


Improving performance of rav1d video decoder
*on macOS with an M3 chip
*slightly more than 1%, on a specific benchmark, without any new unsafe code
A while ago, memorysafety.org announced a contest for improving performance of rav1d, a Rust port of the dav1d AV1 decoder.
As this literally has my name written on it, I thought it would be fun to give it a try (even though I probably can’t participate in the contest).
This is a write-up about two small performance improvements I found (1st PR, 2nd PR) and how I found them (you can also jump to the summary in the end).

Background and Approach
rav1d is a port of dav1d, created by (1) running c2rust on dav1d, (2) incorporating dav1d’s asm-optimized functions, and (3) changing the code to be more Rust-y and safer.
The authors also published a detailed article about the process and the performance work they did.
More recently, the contest was announced, with the baseline being:
Our Rust-based rav1d decoder is currently about 5% slower than the C-based dav1d decoder.
Video decoders are notoriously complex pieces of software, but because we are comparing the performance of two similar deterministic binaries we might be able to avoid a lot of that complexity - with the right tooling.
We can’t expect to find huge wins, and some regressions might be too-hard-to-tackle (for example, LLVM finding a Rust function harder to optimize than the C version), but it’s worth a shot, especially since aarch64 (my environment) is probably less optimized than x86_64.
My approach here was to:
- Use a sampling profiler to capture snapshots of both runs on the same input.
- Use the optimized asm calls as “anchors” since they should match perfectly.
- Compare the Rust and C versions function by function, and if there’s a big enough discrepancy, dive into that function.
Baseline
First things first, we need to build and compare perf locally (using hyperfine and the sample files noted in the contest’s rules and rav1d’s CI).
We’ll be using the single threaded version (--threads 1) to keep things simple.
For rav1d:
$ git clone [email protected]:memorysafety/rav1d.git && cd rav1d && git log -n1
commit a654c1e82adb2d9a33ae50d2a82a7a747102cbb6
$ rustc --version --verbose # set by rust-toolchain.toml
rustc 1.88.0-nightly (b45dd71d1 2025-04-30)
...
LLVM version: 20.1.2
$ cargo build --release
    Finished `release` profile [optimized] target(s) in ..
$ hyperfine --warmup 2 "target/release/dav1d -q -i Chimera-AV1-8bit-1920x1080-6736kbps.ivf -o /dev/null --threads 1"
Benchmark 1: target/release/dav1d -q -i Chimera-AV1-8bit-1920x1080-6736kbps.ivf -o /dev/null --threads 1
  Time (mean ± σ):     73.914 s ±  0.151 s    [User: 73.295 s, System: 0.279 s]
  Range (min … max):   73.770 s … 74.132 s    10 runs
For dav1d:
$ git clone https://code.videolan.org/videolan/dav1d.git && cd dav1d && git checkout 1.5.1
$ brew install llvm@20 && export CC=clang; $CC --version
Homebrew clang version 20.1.4
$ meson setup build "-Dbitdepths=['8','16']"
$ bear -- ninja -C build tools/dav1d
...
[88/88] Linking target tools/dav1d
$ hyperfine --warmup 2 "build/tools/dav1d -q -i Chimera-AV1-8bit-1920x1080-6736kbps.ivf -o /dev/null --threads 1"
Benchmark 1: build/tools/dav1d -q -i Chimera-AV1-8bit-1920x1080-6736kbps.ivf -o /dev/null --threads 1
  Time (mean ± σ):     67.912 s ±  0.541 s    [User: 67.208 s, System: 0.282 s]
  Range (min … max):   66.933 s … 68.948 s    10 runs
So rav1d is about 9% (6 seconds) slower than dav1d for that sample file, at least on an M3 chip.
(Ideally, clang and rustc should use the same LLVM version, but a patch version difference is probably fine.)
(Measured on a MacBook Air M3 with 8 cores.)
Profiling
I used samply which is my current go-to sampling profiler:
./dav1d $ sudo samply record ./build/tools/dav1d -q -i /Chimera-AV1-8bit-1920x1080-6736kbps.ivf -o /dev/null --threads 1
./rav1d $ sudo samply record ./target/release/dav1d -q -i /Chimera-AV1-8bit-1920x1080-6736kbps.ivf -o /dev/null --threads 1
(The Rust binary is also called dav1d, which is a bit confusing.)
By default, samply uses a rate of 1000Hz, which means that (for example) any diff of 500 samples in a function will account for about 0.5 second of runtime difference.
Usually, starting with the “inverted stack” view helps to narrow down interesting options (which we’ll explore in the next section), but this time we want to focus on the anchors we know should match: the asm functions.
You can view the full profiler snapshots online in the Firefox Profiler (dav1d, rav1d), but here are the relevant, filtered, clippings (Note: these are not interactive. Check out the links if you want to explore more).
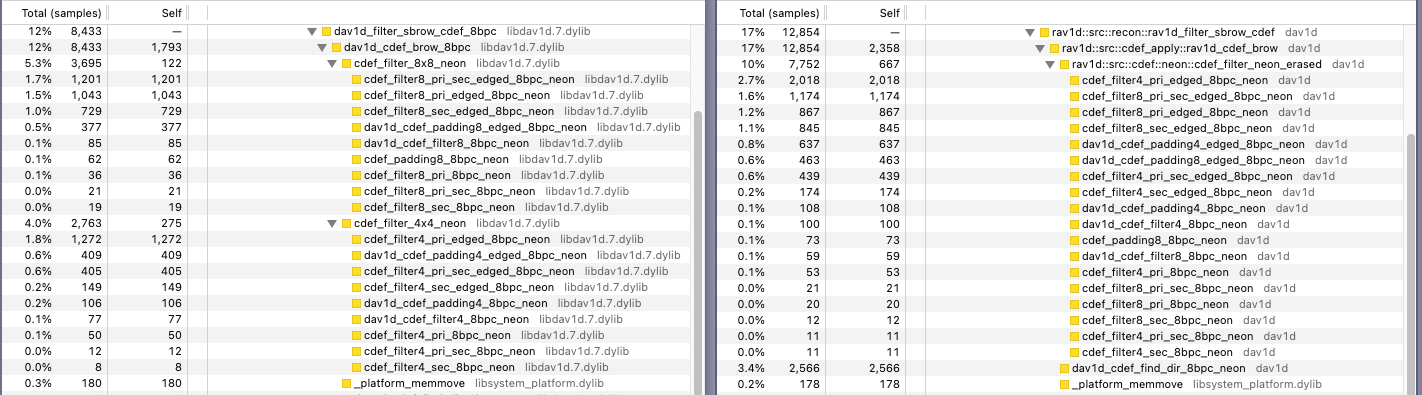
First, here’s the dav1d (C) version (total number of samples: ~69,500):
Next, here’s the rav1d (Rust) version (total number of samples: ~75,150):
Look at the highlighted functions, dav1d_cdef_brow_8bpc and rav1d_cdef_brow.
The Total sample count is the number of samples where this function was seen “anywhere in the stack” which means it includes any “children” functions called by it. The Self sample count is the number of samples in which this was the executing function, so it doesn’t include the children’s sample counts.
There is a slight divergence between dav1d and rav1d: while the _neon extension notes the Arm-specific assembly functions that are shared between the two binaries, we see that:
dav1dcallscdef_filter_8x8_neonandcdef_filter_4x4_neon, and each of them dispatches the relevant assembly functions (either the8or the4version, respectively).rav1dcallscdef_filter_neon_erased, which handles the dispatch of all the assembly functions.
We can also see that cdef_filter8_pri_sec_edged_8bpc_neon has almost identical sample counts in both snapshots, which means we are on the right track.
Let’s ignore the cdef_filter4_pri_edged_8bpc_neon function which doesn’t match, at least for now (foreshadowing a possible part 2 in the series).
This means that (A) the Self sample count for dav1d_cdef_brow_8bpc should match rav1d_cdef_brow,
and (B) that summing both cdef_filter_{8x8,4x4}_neon Self sample counts should match cdef_filter_neon_erased Self sample count.
Now we see something interesting: focusing in the second part, the summed Self sample count of cdef_filter_{8x8,4x4}_neon is about 400 samples, while rav1d’s cdef_filter_neon_erased is almost 670 samples. We can also see that dav1d_cdef_brow_8bpc is 1790 samples, vs rav1d_cdef_brow’s 2350 samples.
Together, this difference accounts for about 1% of the total runtime of rav1d!
Jumping to the cdef_filter_neon_erased implementation, except for a bunch of pointer casting using .cast(),
there’s only one “big thing” going on that’s not part of the call-to-asm machinery:
#[deny(unsafe_op_in_unsafe_fn)]
pub unsafe extern "C" fn cdef_filter_neon_erased<
    BD: BitDepth,
    const W: usize,
    const H: usize,
    const TMP_STRIDE: usize,
    const TMP_LEN: usize,
>(
    // .. snip ..
) {
    use crate::src::align::Align16;

    // .. snip ..

    let mut tmp_buf = Align16([0u16; TMP_LEN]);
    let tmp = &mut tmp_buf.0[2 * TMP_STRIDE + 8..];

    padding::Fn::neon::<BD, W>().call::<BD>(tmp, dst, stride, left, top, bottom, H, edges);
    filter::Fn::neon::<BD, W>().call(dst, stride, tmp, pri_strength, sec_strength, dir, damping, H, edges, bd);
}
With TMP_LEN being 12 * 16 + 8 = 200 or 12 * 8 + 8 = 104, so tmp_buf = [u16; 200] in the worst case.
That’s a lot of memory to zero for a scratch buffer!
What does dav1d do here?
#define DEFINE_FILTER(w, h, tmp_stride)                                      \
static void                                                                  \
cdef_filter_##w##x##h##_neon(/* .. snip .. */)                               \
{                                                                            \
    ALIGN_STK_16(uint16_t, tmp_buf, 12 * tmp_stride + 8,);                   \
    uint16_t *tmp = tmp_buf + 2 * tmp_stride + 8;                            \
    BF(dav1d_cdef_padding##w, neon)(tmp, dst, stride,                        \
                                    left, top, bottom, h, edges);            \
    BF(dav1d_cdef_filter##w, neon)(dst, stride, tmp, pri_strength,           \
                                   sec_strength, dir, damping, h, edges      \
                                   HIGHBD_TAIL_SUFFIX);                      \
}

DEFINE_FILTER(8, 8, 16)
DEFINE_FILTER(4, 8, 8)
DEFINE_FILTER(4, 4, 8)
A few macro expansions later, we get uint16_t tmp_buf[200] __attribute__((aligned(16)));
This means that tmp_buf isn’t initialized by the cdef_filter_{8x8,4x4}_neon functions:
instead, it is used as a write destination for the padding assembly function,
and later by the filter assembly function as-is.
It seems likely that the compiler doesn’t know this initialization can be eliminated,
and we can also use --emit=llvm-ir to see it more even directly:
$ RUSTFLAGS="--emit=llvm-ir" cargo build --release --target aarch64-apple-darwin
; rav1d::src::cdef::neon::cdef_filter_neon_erased
; Function Attrs: nounwind
define internal void @_ZN5rav1d3src4cdef4neon23cdef_filter_neon_erased17h7e4dbe8ecff68724E(ptr noundef %dst, i64 noundef %stride, ptr noundef %left, ptr noundef %top, ptr noundef %bottom, i32 noundef %pri_strength, i32 noundef %sec_strength, i32 noundef %dir, i32 noundef %damping, i32 noundef %edges, i32 noundef %bitdepth_max, ptr nocapture readnone %_dst, ptr nocapture readnone %_top, ptr nocapture readnone %_bottom) unnamed_addr #1 {
start:
  %tmp_buf = alloca [400 x i8], align 16
  call void @llvm.lifetime.start.p0(i64 400, ptr nonnull %tmp_buf)
  call void @llvm.memset.p0.i64(ptr noundef nonnull align 16 dereferenceable(400) %tmp_buf, i8 0, i64 400, i1 false)
  %_37 = getelementptr inbounds nuw i8, ptr %tmp_buf, i64 80
  call void @dav1d_cdef_padding8_16bpc_neon(ptr noundef nonnull %_37, ptr noundef %dst, i64 noundef %stride, ptr noundef %left, ptr noundef %top, ptr noundef %bottom, i32 noundef 8, i32 noundef %edges) #121
  %edges2.i = zext i32 %edges to i64
  %_0.i.i.i.i = and i32 %bitdepth_max, 65535
  call void @dav1d_cdef_filter8_16bpc_neon(ptr noundef %dst, i64 noundef %stride, ptr noundef nonnull readonly align 2 %_37, i32 noundef %pri_strength, i32 noundef %sec_strength, i32 noundef %dir, i32 noundef %damping, i32 noundef 8, i64 noundef %edges2.i, i32 noundef %_0.i.i.i.i) #121
  call void @llvm.lifetime.end.p0(i64 400, ptr nonnull %tmp_buf)
  ret void
}
Avoid Needlessly Zeroing Buffers with MaybeUninit
This should be pretty easy actually! Rust has std::mem::MaybeUninit for just such an occasion:
-let mut tmp_buf = Align16([0u16; TMP_LEN])
+let mut tmp_buf = Align16([MaybeUninit::::uninit(); TMP_LEN]);
We can still take a sub-slice safely (&mut tmp_buf.0[2 * TMP_STRIDE + 8..]), but we will need to update the signatures of the inner functions to use the new type (tmp: *mut MaybeUninit, tmp: &[MaybeUninit).
Since the code that used these was unsafe anyway, we don’t need to add any new unsafe blocks - only to verify that the existing code hasn’t changed (w.r.t dav1d) to rely on this buffer being zeroed.
Before, cdef_filter_neon_erased had 670 Self samples. Re-running the profiler, we get a new snapshot:
Just 274 samples! Slightly less than dav1d’s cdef_filter_{8x8,4x4}_neon Self sample count.
Maybe this isn’t the only place where time is wasted zeroing buffers? A quick search for other big Align16 buffers resulted in this lucky find:
pub(crate) fn rav1d_cdef_brow<BD: BitDepth>(/* .. snip ..*/)
{
    // .. snip ..

    for by in (by_start..by_end).step_by(2) {
        // .. snip ..
        let mut lr_bak =
            Align16([[[[0.into(); 2 /* x */]; 8 /* y */]; 3 /* plane */ ]; 2 /* idx */]);

        // .. snip ..
    }
}
Again, the matching code from dav1d doesn’t initialize this buffer.
Here, switching to MaybeUninit is more difficult, but we can still offer a modest improvement: we’ll only need to do the initialization once if we hoist lr_bak to the top level!
pub(crate) fn rav1d_cdef_brow(/* .. snip ..*/)
{
    // .. snip ..
+   let mut lr_bak =
+       Align16([[[[0.into(); 2 /* x */]; 8 /* y */]; 3 /* plane */ ]; 2 /* idx */]);

    for by in (by_start..by_end).step_by(2) {
        // .. snip ..
-       let mut lr_bak =
-           Align16([[[[0.into(); 2 /* x */]; 8 /* y */]; 3 /* plane */ ]; 2 /* idx */]);

        // .. snip ..
    }
}
Since dav1d never initialized it anyway, we know that logically any data read from this buffer was written beforehand with a valid value
(which really helps to drive home the idea that Undefined Behavior deserves a better reputation). The savings are very small here, but every penny counts!
Running the full benchmark, we get a nice speed boost from the original 73.914 s ± 0.151 s:
$ hyperfine --warmup 2 "target/release/dav1d -q -i Chimera-AV1-8bit-1920x1080-6736kbps.ivf -o /dev/null --threads 1"
Benchmark 1: target/release/dav1d -q -i Chimera-AV1-8bit-1920x1080-6736kbps.ivf -o /dev/null --threads 1
  Time (mean ± σ):     72.644 s ±  0.250 s    [User: 72.023 s, System: 0.239 s]
  Range (min … max):   72.281 s … 73.098 s    10 runs
There’s still a way to go to dav1d’s 67.912 s ± 0.541 s, but 1.2 seconds (1.5%) improvement in total runtime is a great start, and covers about 20% of the performance diff between the two.
Profiling Again, But Inverted
Let’s reload the profiler outputs from the start, but use the “inverted stack” view.dav1d (C) (Link): rav1d (Rust) (Link):
There are a few options we can explore for optimization, but the function that got my attention was add_temporal_candidate: the difference between the Rust and the C version is significant enough (~400 samples, about 0.5 seconds),
and the function itself seems innocuous: it’s about 50 lines of ifs and fors, with a few calls to short utility functions.
To help us find out where we are bleeding out the missing performance, we can try to recompile rav1d with debug symbols.
The rav1d project helpfully defines a [profile.release-with-debug] in its Cargo.toml, allowing us to run:
$ cargo build --profile=release-with-debug
$ sudo samply record target/release-with-debug/dav1d ...
What we get back is slightly different than before (Link): the release-with-debug profile will not be as-optimized,
and small functions calls appear bigger than they really are, but we get a line-by-line sample breakdown of the function, and it should steer us in the right direction.
If you scroll a little, one thing that will jump out to you will be that the if cand.mv.mv[0] == mv { and if cand.mv == mvp { lines seem to cover a combined 600 samples!
Let’s pull up mv: Mv’s definition:
#[derive(Clone, Copy, PartialEq, Eq, Default, FromZeroes, FromBytes, AsBytes)]
#[repr(C)]
pub struct Mv {
    pub y: i16,
    pub x: i16,
}
Huh. How can this be slow? It’s just #[derive(PartialEq)].

And even more suspiciously, the dav1d version is slightly different, and uses mvstack[n].mv.n == mvp.n to do the same comparisons.
But what is n? Looking at dav1d’s definition of mv, we find:
typedef union mv {
    struct {
        int16_t y, x;
    };
    uint32_t n;
} mv;
It seems like the dav1d authors knew that comparing two i16s can be slow, so when they compare two mvs, they treat them as u32s.
Replace Field-wise Equality with Byte-wise Equality that Optimizes Better
Can this be the problem?
Defining Mv as a union has a big downside in Rust: it makes it unsafe to access any field of the union,
which will “infect” every usage of Mv, which is the opposite of what we usually want to do in Rust (trying to encapsulate unsafety in a safe API).
Fortunately, we have a different option: We can use transmute to re-interpret Mv as a u32, and use that to implement PartialEq.
Firing up Godbolt, we can inspect the generated code for the two ways to do the comparison:
Clearly the transmute version is superior, but can we avoid the unsafe block?1
It turns out that the zerocopy crate can statically verify the safety requirements for a struct to be represented as &[u8], allowing us to write:
use zerocopy::{AsBytes, FromBytes, FromZeroes};

#[derive(Clone, Copy, Eq, Default, FromZeroes, FromBytes, AsBytes)]
#[repr(C)]
pub struct Mv {
    pub y: i16,
    pub x: i16,
}

impl PartialEq for Mv {
    #[inline(always)]
    fn eq(&self, other: &Self) -> bool {
        self.as_bytes() == other.as_bytes()
    }
}
Which produces the same (optimized) assembly we saw when we used transmute.
After implementing similar optimizations for RefMvs{Mv,Ref}Pair, we can re-run the benchmark:
$ hyperfine --warmup 2 "target/release/dav1d -q -i Chimera-AV1-8bit-1920x1080-6736kbps.ivf -o /dev/null --threads 1"
Benchmark 1: target/release/dav1d -q -i Chimera-AV1-8bit-1920x1080-6736kbps.ivf -o /dev/null --threads 1
  Time (mean ± σ):     72.182 s ±  0.289 s    [User: 71.501 s, System: 0.242 s]
  Range (min … max):   71.850 s … 72.722 s    10 runs
This is another 0.5 second improvement over our previous result (72.644 s ± 0.250 s), or a 2.3% improvement over the baseline (73.914 s ± 0.151 s).
We are now only 4.2 seconds from dav1d’s 67.912 s ± 0.541 s, so we covered about 30% of the performance diff we saw at the start of this article.
You might be wondering why the default implementation of PartialEq results in bad code generation,
and a comment on the PR adding these impls pointed to Rust issue #140167,
which tracks exactly this type of problem.
If you consider the C case, when using a struct { int16_t y, x; } it’s possible to initialize only y while leaving x uninitialized.
As long as equality is checked with this.y == other.y && this.x == other.x and all ys are different, you don’t get any UB.
Therefore, it’s invalid to optimize this to a single memory load and compare unless the code can guarantee that all fields are always initialized. However, quoting this comment by @hanna-kruppe on the issue:
That’s not simply a missed optimization opportunity. While the load of the second field can’t load poison/undef, that property is control-dependent. ..
Solving this seems hard: I don’t think LLVM has a way to express “loading through this pointer always reads initialized bytes”.
Summary
Using a few profiler snapshots from the samply profiler, we compared running rav1d and dav1d on the same input file, saw a 6-second (9%) runtime difference, and found two relatively low hanging fruits we could optimize:
- Avoiding an expensive zero-initialization in a hot, Arm-specific code path (PR), improving runtime by 1.2 seconds (-1.6%).
- Switching the default
PartialEqimpls of small numericstructs with an optimized version that re-interpret them as bytes (PR), improving runtime by 0.5 seconds (-0.7%).
Each of these provide a nice speedup despite being only a few dozen lines in total, and without introducing new unsafety into the codebase.
The rav1d project maintainers were nice and responsive, and helped make these PRs more correct and better overall (big shout out to @kkysen 🚀).
There is still a gap of about 6% between the two implementations so there are still many more optimizations to discover,
and I suspect this approach of comparing between profiler snapshots of dav1d and rav1d will yield at least some of them.
Go ahead and give this a try! Maybe rav1d can eventually become faster than dav1d 👀🦀.
Discuss on r/rust, lobsters, HN! 👋
If you liked this, you might also like Debugging a Vision Transformer Compilation Issue and Making Python 100x faster with less than 100 lines of Rust.
Safety note: While the
use_transmutefunction is safe, it is a bit subtle: becausemem::align_of::, we must dereference!= mem::align_of:: () &Mvbeforehand. Try running Miri in this Playground link. ↩︎
What's Your Reaction?
 Like
0
Like
0
 Dislike
0
Dislike
0
 Love
0
Love
0
 Funny
0
Funny
0
 Angry
0
Angry
0
 Sad
0
Sad
0
 Wow
0
Wow
0