


Modeling land value taxes
In the past few weeks, I've published two reports modeling land value tax (LVT) shifts, one for South Bend, IN, and another for Syracuse, NY. The reports can be found here. A previous Progress and Poverty post discussed the South Bend results more in-depth. These analyses offer a glimpse into how a shift towards taxing land more heavily than buildings could impact a city's residents and economy.
To make this type of analysis more accessible, I've created an open-source repository called LVTShift, which contains the essential functions for you to model an LVT yourself. The repository also includes a notebook using South Bend as a practical example, allowing you to recreate my South Bend report step-by-step.
Progress and Poverty is a reader-supported publication. To receive new posts and support my work, consider becoming a free or paid subscriber.
So, are you curious about what a land value tax shift could look like in your city? Let's dive into the methodology.
Creating the Policy: Defining Your LVT Model
Before you crunch any numbers, it's crucial to clearly define the policy you want to study. My reports typically assume a revenue-neutral policy where traditional property taxes are split into two components: one on buildings and one on land. However, your goals might differ. Here are some key questions to consider:
Revenue Neutrality: Are you aiming for a revenue-neutral policy, or are you modeling something different? Under a revenue neutral shift, the total amount of tax money collected before and after the tax shift is the same, the only thing that changes is where the tax money comes from. For instance, if you're analyzing a new transit project, you might not assume revenue neutrality if the goal is to create a special tax district to fund it.
Tax Burden Shift: Are you proposing a split-rate tax that shifts the building tax burden to land? While my models focus on split-rate property taxes, some cities and states rely heavily on income or sales taxes. A comparative study on shifting other tax burdens to land could be worthwhile in areas where property taxes constitute a smaller portion of overall revenue.
Full vs. Partial LVT Shift: Are you modeling a complete land value tax shift or a partial one? I typically model a 4:1 split-rate tax, meaning land is taxed at four times the rate of buildings.
Exemptions, Abatements, Classifications, and Tax Caps: How will existing exemptions, abatements, classifications, and tax caps apply to your proposed policy? States frequently mandate exemptions for groups like seniors and veterans, and some buildings are fully exempt. I generally apply all state exemptions to my modeling, assuming their continuation. You'll need to decide whether to apply these exemptions to the building value, the land value, or a combination. In my analyses, I usually apply them to the building value first.
A key learning from my South Bend report highlighted the importance of understanding local tax regulations. In South Bend, 95% of properties were already hitting their maximally allowable property tax by state statute. This meant a direct LVT shift would have had minimal impact for most properties. Consequently, I modeled for the South Bend School Corporation, which had passed a referendum that circumvented these tax caps, allowing for a more impactful analysis.
Alright, with these considerations in mind, we now have a clear understanding of what we want to study. For the remainder of this explainer, we'll focus on South Bend as our example: a revenue-neutral property tax split for the South Bend School Corporation, with existing exemptions and abatements applied.
Getting the Data: Finding Your City’s Property Records
Now that we've defined our policy, it's time to gather the raw material: property tax data. Fortunately, most counties — though not all — make this information publicly accessible. Your first step is to search for your county's open data portal. Try a search like: "St Joseph County Indiana Property Tax Open Data."
Often, if you see a search result that includes "GIS" (Geographic Information System), that's usually your golden ticket. Sometimes, however, you might need to dig a bit deeper into the assessor's website to find it.
In the case of St. Joseph County, Indiana, a few results down, I found "St Joseph County IN GIS," which led to an ArcGIS link. Navigating to the full map on such platforms usually provides a way to extract the underlying data. With ArcGIS, it's relatively straightforward.
There are at least a couple of options to extract this data:
Using GIS Software: You can load the data directly into a GIS software package. Both ArcGIS (a paid service) and QGIS (a free, open-source alternative) allow you to create a new map and upload a layer directly from an ArcGIS link. Once loaded, you can then extract the data to a CSV file for further analysis.
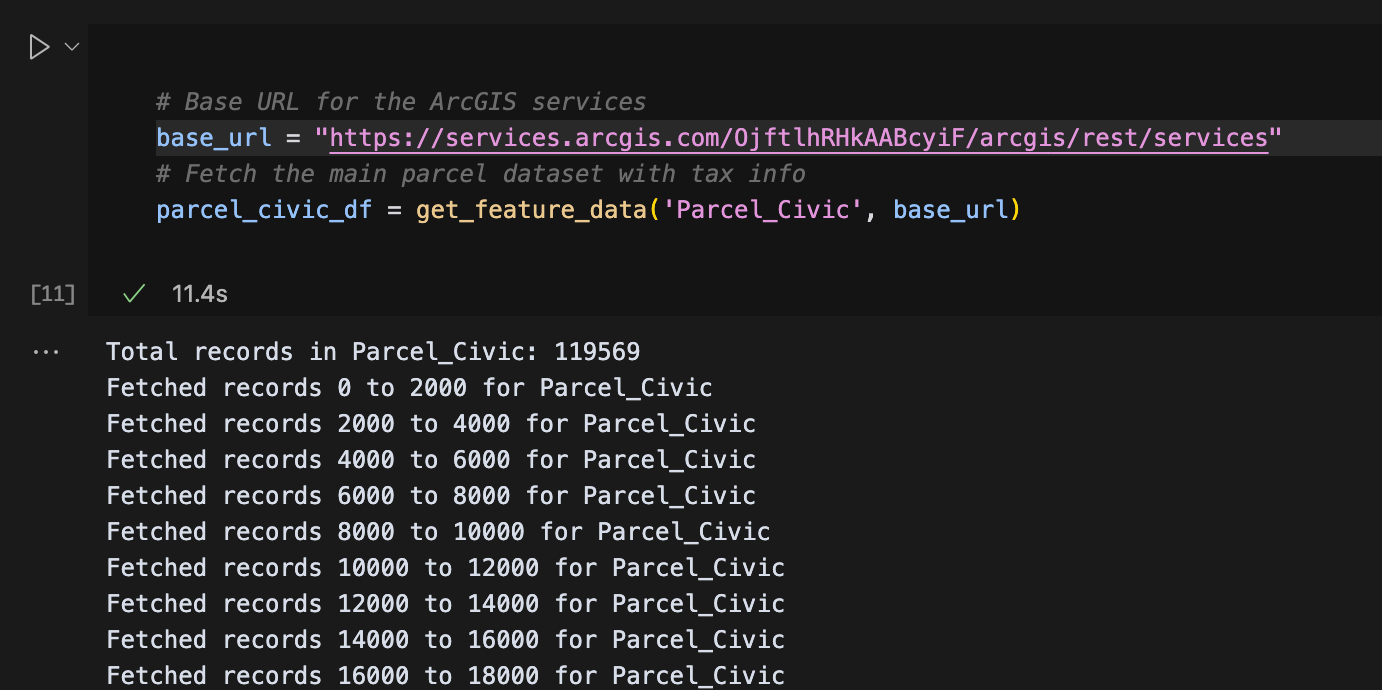
Programmatic API Pull (My Preference): This is typically my method. I'll inspect the ArcGIS page and look at its network requests to find the root of the API endpoint. For South Bend, this was:
https://services.arcgis.com/OjftlhRHkAABcyiF/ArcGIS/rest/services
The LVTShift repository provides code examples for programmatically pulling this data, and the South Bend notebook specifically demonstrates this process. This method offers greater flexibility and reproducibility for your analysis.
You may also find that your county has a direct download link for the data somewhere on the assessors website. That will work, too!
Disclaimer: The method presented here relies on assessor data and valuations of land and improvement value. The quality of assessments varies by county, and oftentimes, assessors overlook the land valuation portion as they focus on properly assessing the full market value of a property. It's always easier to propose a shift that doesn't also require the assessment office to adopt an entirely new set of valuations. In any case, you can use this method with either pre-existing assessed values or ones you have modeled yourself. In this case we will use the assessor's existing land valuations.
Understanding the Data: What’re These Columns?
Great! We have the data, now let’s understand it. Typically, the data has a few columns that we care about.
First and foremost, your data should include full market value (FMV), often paired with separate land value and improved value (or building value) fields. A fundamental check here is that Land Value + Improved Value should generally equal FMV. You might also find a “taxable value” or “assessed value” field, which represents the full market value after various exemptions and appraisal caps have been applied. There may also be specific fields detailing the exemption amounts themselves.
There will also be columns for parcel characteristics, such as neighborhood, building type, land use descriptions, and zoning information. These fields will be important to understand the impacts of split rate tax based on categories of properties, such as: what’s the impact of split-rate on single-family homes?
Recreating the Property Tax: Confirming Current Revenue
With your data understood, the next critical step is to recreate your municipality's current property tax revenue using the data you've gathered. This is a crucial validation step to ensure your dataset accurately reflects the real-world tax landscape.
Start by going online to find the most recent year's published budget for your municipality, along with its millage rate.
Quick aside: millage rate is the tax rate that gets multiplied against a property’s assessed value to determine how much that property owner owes in actual taxes. For whatever historical reason, this is expressed as millage–parts per thousand–rather than percent–parts per hundred–which is why it’s called a “millage” rate. A single 1/1000th is often referred to as a “mill,” so if you ever see e.g. “20 mills,” you can know that is equivalent to 2 percent. If your house is worth $100,000 and the millage rate is 10 mills, your tax rate is 1% and your tax bill is $1000.
Your goal is to locate the projected revenue from the property tax and then verify that your data, when run through the assigned millage rate, produces a similar figure.
For the South Bend School Corporation, for example, I found a millage rate of 3.3 mills ($3.3 per $1,000 in value), which was projected to yield a certified levy of $27 million. I uncovered this information by exploring St. Joseph County's budget order, which conveniently contained both pieces of data. In other municipalities, you might need to find the city's budget and millage rate separately.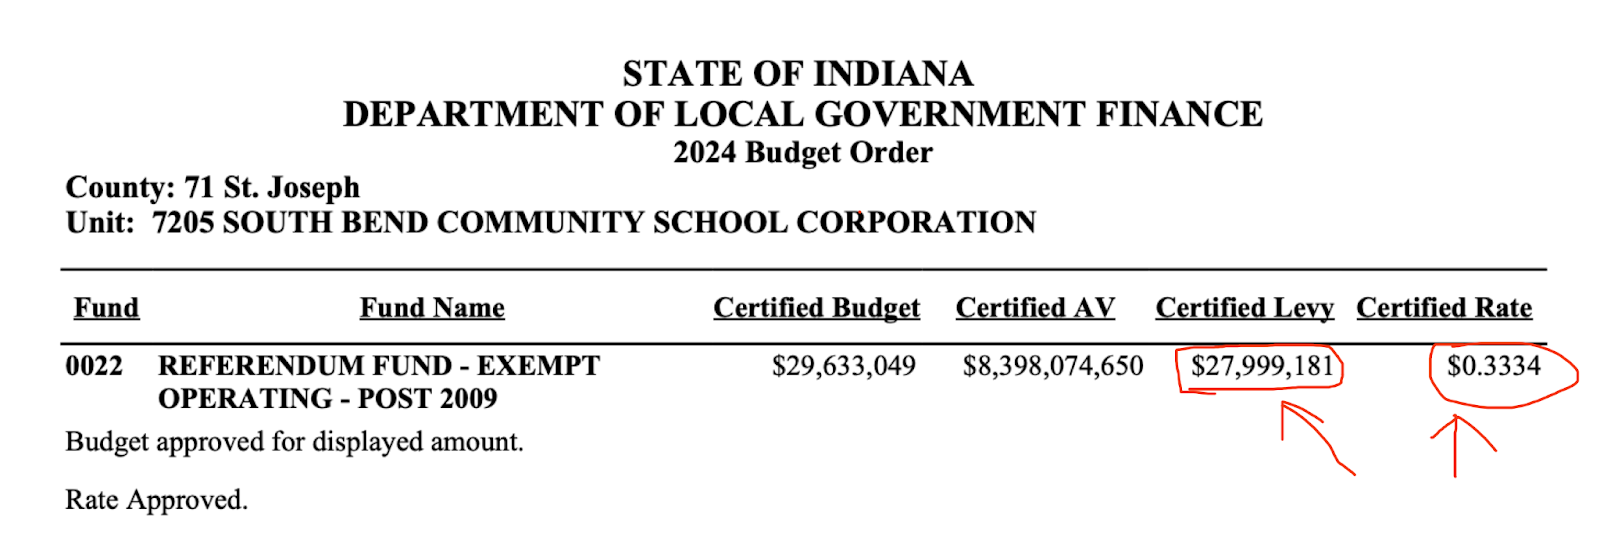
Now, my objective was to replicate this $27 million. I set my millage rate to 3.3 mills and created a column for taxable value, which is the full market value minus any exemptions. It's also vital to ensure that any fully exempt properties are excluded from this analysis.
I then ran the property tax for every parcel and summed the result: $40 million. Uh oh. This is much greater than $27 million than the city actually anticipates from their millage rate. I must’ve done something wrong.
This is a common hurdle in the iterative process of understanding your data! After some digging, I realized I needed to further restrict my dataset to include only parcels located within the specific South Bend tax districts.
After applying that filter, I arrived at $24 million. This was close enough to the certified levy for me to feel confident moving forward. You've now successfully calculated the current tax paid for every parcel in your dataset, setting the stage for modeling the LVT shift.
Modeling Land Value Tax
Now is the exciting part: modeling LVT!
When we recreated the current property tax structure, we had to subtract exemptions from full market value to create a full taxable value. Remember, we set out to model land value tax shift assuming exemptions still applied. Therefore, since we now want to administer taxes independently on land and buildings, we must get two taxable values: taxable land value and taxable building value.
To derive these taxable values, I begin by taking the full building value and subtracting any applicable exemptions. This means exemptions first apply to the building. For many parcels, you can stop there. However, sometimes the exemption will be greater than the building value.
If the exemption amount exceeds the building's worth, I then apply the remaining exemption to the land value. This process ensures that properties don't over-benefit from exemptions and that the full value of any exemptions is accounted for.
Next, we sum up all the taxable building value and all the taxable land value across the entire dataset. These totals are essential for calculating our new millage rates. Now, we can solve for the building millage rate under our proposed split-rate tax, knowing that we want land to be taxed at a specific multiple (e.g., four times) the rate of buildings.
The formula for solving this is:
Total Current Tax Revenue = (Building Millage) * Total Building Taxable + 4 * (Building Millage) * Total Land Taxable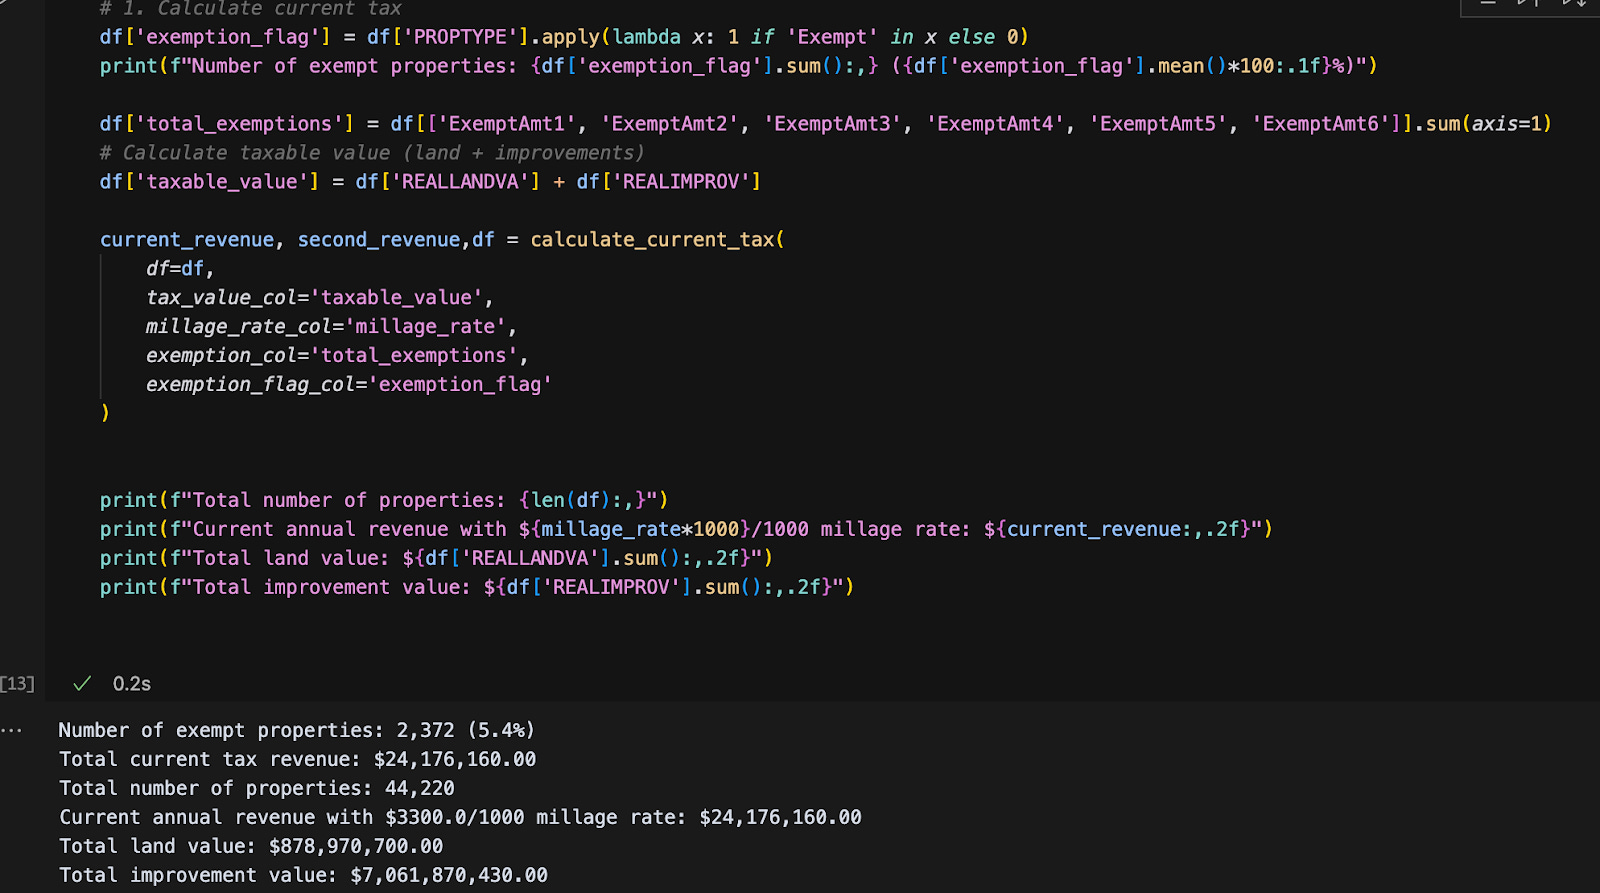
For our South Bend example, we find a building millage rate of $2.28 and land millage rate of $9.14. Using these millage rates on every parcel's taxable improvement value and taxable land value, we now have parcel-level split-rate land value tax modeled.
LVTShift handles all of the above logic using just a couple of functions (calculate_current_tax and model_split_rate).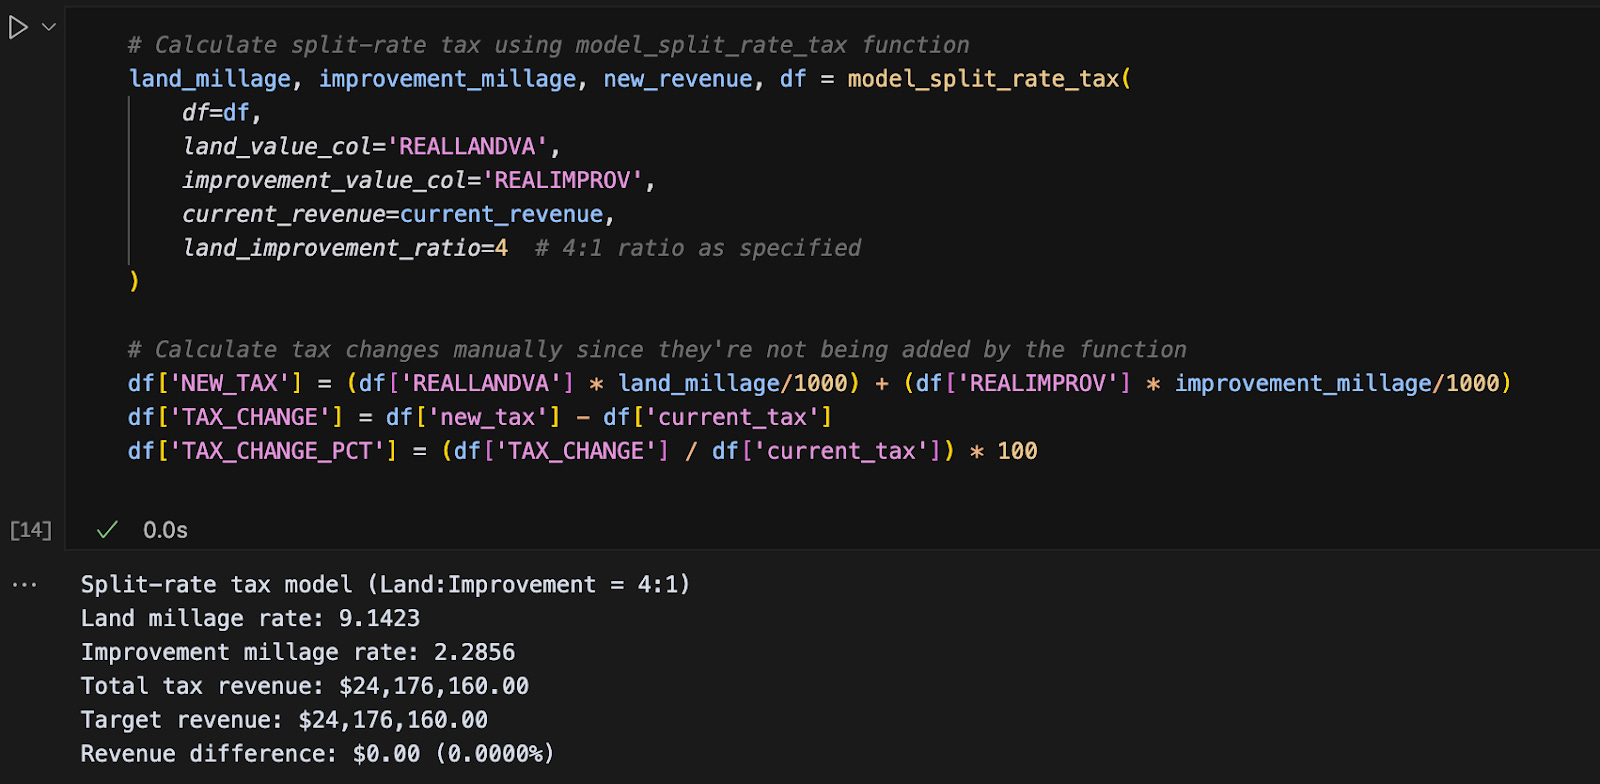
Data Analysis
With parcel level information, we can now understand the impacts. There are countless ways to slice and dice the data to understand the potential impacts of your proposed policy.
Typically, the first insights we seek reveal which property types and neighborhoods are impacted most significantly. You can readily calculate the mean and median percentage change in tax burden by property type (e.g., single-family homes, apartments, commercial properties, vacant lots) and by neighborhood. This initial breakdown provides a high-level overview of the winners and losers.
But, why stop there? Many cities care deeply about the progressivity of the policy. We can match every parcel to its census block group and programmatically pull every block group's median income and racial demographics. LVTShift allows users to do this easily, just plug in your county’s FIPS code (trivially Google-able), and you will get back every parcel’s census block group with the joining data.
This enables powerful analyses like the one I performed for South Bend, which illustrated that the tax burden of the LVT shift tended to fall more heavily on higher-income neighborhoods. In the chart, I have plotted census block groups and their median tax change in a shift. As median income of a block group increases, the tax burden of a LVT shift also increases. The horizontal dotted red line represents no median tax change, the tilted line shows the general trend of the tax burden as median income increases.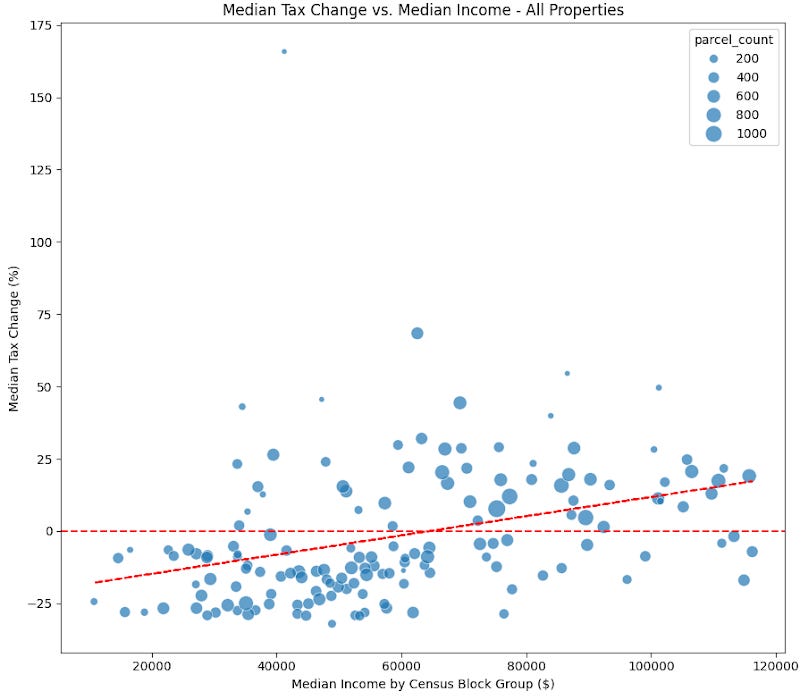
Furthermore, many communities are interested in the impact on out-of-state speculators or absentee owners. We can use the mailing address column (which indicates where the property tax bill is sent) as a proxy for ownership. If the mailing address is out-of-state, it's a strong indicator of an out-of-state owner. Analyzing property tax burden shifts from this perspective can provide valuable insights for policymakers.
Ultimately, with this data, we have now fully modeled a land value tax shift in South Bend. This is the data analysis that was done for a final report written by Notre Dame’s Student Policy Network and presented to the City of South Bend. The report is available here.
Want to model your city? Feel free to give it a try and let me know how it goes. I put together the repository over the past few days combining code from a few bits of analysis I have done. Over time, we can make it more powerful so everyone can easily model their city. Reach out: [email protected].
Progress and Poverty is a reader-supported publication. To receive new posts and support my work, consider becoming a free or paid subscriber.
What's Your Reaction?
 Like
0
Like
0
 Dislike
0
Dislike
0
 Love
0
Love
0
 Funny
0
Funny
0
 Angry
0
Angry
0
 Sad
0
Sad
0
 Wow
0
Wow
0