


![Soudan : le nouveau Premier ministre affiche sa volonté d’éliminer la rébellion [Africanews Today]](http://static.euronews.com/articles/stories/09/31/28/12/640x360_cmsv2_915145b4-a88f-5ea5-b479-9065fb1bc6fb-9312812.jpg?1748883151#)


Georgists Valued Land in the 1900s

This is the second article in the series Mass Appraisal for the Masses. Here’s a link to the previous article.
While we moderns look to computerized geospatial analysis to solve the thornier aspects of land valuation, Georgists writing one hundred years ago, lacking all our modern innovations, claimed that valuing land was no great trouble at all. What was their secret?
Progress and Poverty is a reader-supported publication. To receive new posts and support my work, consider becoming a free or paid subscriber.
Research the art of land valuation around the turn of the last century and you will find the “Somers System” of land appraisal, named after its inventor, one William A. Somers, an employee of the Manufacturers’ Appraisal Company.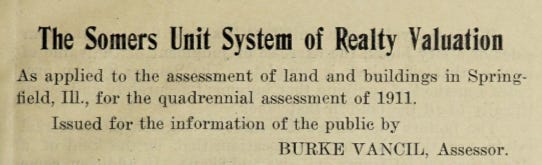
Early documentation comes mostly in the form of terse pamphlets, but in the late 1920’s company president Walter Pollock sat down and published a full walk through in meticulous detail.
Pollock’s book, co-authored by University of Pennsylvania economics professor Karl Scholz, has long been out of print. Fortunately it’s in the public domain and you can download and read the whole thing for free courtesy of Google Books.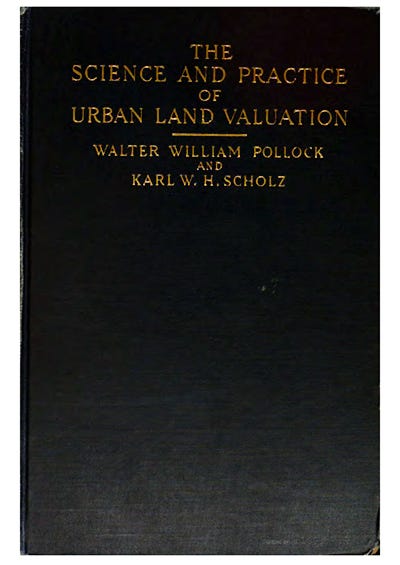
Skeptics might reasonably assert that the job of land assessment was much easier a hundred years ago because cities were smaller and the economy more centered on agriculture.
This reasonable intuition is contradicted by the fact that America was at this very period urbanizing at a rapid pace, with the skyscraper trend already well under way since the 1880’s. New York City’s population was above 3 million in 1900, and exceeded 5 million by 1920. According to the book, the Somers system was used in some shape or form in big cities listed in the table below. 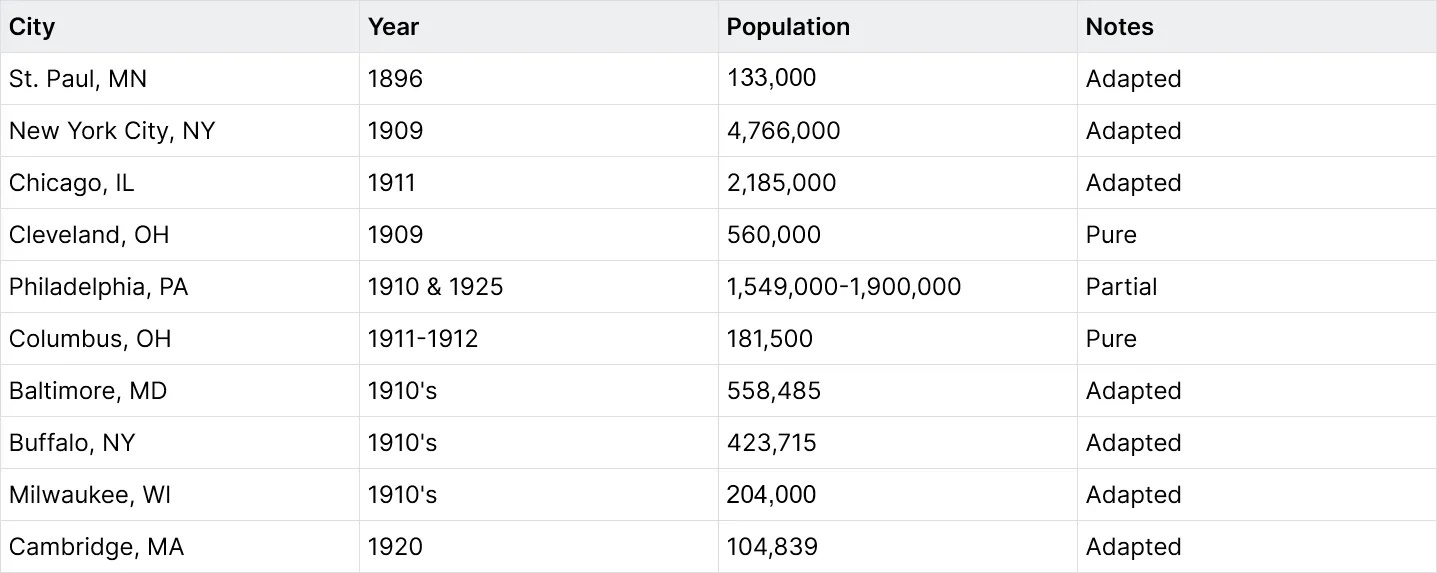
Ironically, some of these cities are actually smaller today—Cleveland has fallen to 362K, and Buffalo to 274K, while others, such as Baltimore and Philadelphia have fallen from their all-time peaks and settled close to their historical sizes at 565K and 1.5M, respectively.
In all, the book claims that over 70 American cities adopted the Somers system in whole or in part. In some places, such as Baltimore, the system was used for analytical purpose rather than for official valuations, whereas in others (Cleveland and Columbus) it was implemented to the letter. Still other jurisdictions modified it in various ways to suit local purposes.
So what was the magic formula? How did the Somers system actually work? How did its assessors establish a fair, mathematically uniform, and easily explainable value for every single parcel of land, entirely separate from the value of the buildings sitting on top, without the aid of so much as a pocket calculator?
They just asked people.
Okay, it’s a bit more complicated than that.
Asking people to set their own values on land is at the heart of this system, but the Somers system should not be confused with Harberger taxes, which this blog has previously discussed. Under Harberger taxes, a landowner self-assesses the taxable value of their own land, with the catch that anyone else is allowed to buy the land at that self-assessed price. This is a different system entirely.
If I had to describe the Somers system in one sentence, I’d put it like this:
Summon a bunch of locals, get them to collectively color in a local land value map, then feed that map as the input to a boring algorithm that spits out fair and equitable land valuations.
If I had to describe it in several hundred sentences (with pictures!), I’d write the rest of this article.
What follows is a detailed explanation of the Somers system, compared and contrasted throughout with modern methods. I conclude with my thoughts on its viability as well as a technical outline for how modern mass appraisal specialists could implement it using modern computers and GIS technology.
Caveats
One thing I should make clear up front is that I’m reviewing this system, not necessarily advocating for it. It’s not the method I use in my day-to-day land valuation work, it’s over a hundred years old, I have never tried it before, and I have no idea if it works as advertised. It also doesn’t account for the single biggest change to cities since the 1900’s—the universal adoption of Euclidean zoning and land use regulations, which had barely started in Pollock’s time. Finally, the book is written by the president of the company that invented the method, which means that while we may still treat the book as an earnest educational resource, we must also understand it in part as marketing material.
With all that out of the way, let’s learn how to value land like it’s Nineteen-Zero-Nine.
The Somers System in a nutshell
There’s two phases to the Somers system:
Just ask people what the base land value of each location is
Feed the results to a boring algorithm that calculates final land values per parcel
Phase 1 goes like this:
The assessor gathers a bunch of local citizens in a big, well-advertised town hall meeting, puts a big map on the back of the wall, passes out little slips of paper, and gets everybody talking. The assessor leads the community in collectively setting consensus land values on every stretch of street frontage in the city.
The assessor posts the results of the first meeting in the local newspaper and also puts them on prominent display in a public place and invites people to make all their complaints and corrections. This is repeated as many times as necessary until consensus is achieved and results are finalized.
Phase 2 goes like this:
The assessor hands the resulting land value maps to a team of human computers who bust out their slide rules and get to work calculating the land value of every single parcel in the city according to a strict mathematical procedure.
Voila, you have valued all the land in the entire city, and even better, you’ve got the local citizenry’s buy-in for both the valuation methodology and the final land values themselves, all well before property tax protest season even begins.
My first impression upon reading this was that it sounded totally crazy.
Not only does it contradict the received wisdom from the YIMBY movement that community input is bad actually, it also circumvents most of the traditional appraisal approaches taught today.
I asked around to see if any assessors I’ve worked with from various local governments were familiar with the Somers system. None had even heard of it prior to my mentioning, and historical references to it seem to all but vanish once the Great Depression sets in. Somers himself died in 1916, and his method is barely mentioned in modern appraisal literature outside the occasional historical survey.
Although appraisal history sometimes credits the Somers system as the first modern mass appraisal system, only a few aspects seem to have survived into universal modern practice. The first is just that there should be a consistent and uniform system at all, and the second is that there should be some mechanism for community feedback, criticism and protest by taxpayers. Other than that, the particulars of the system have been mostly lost to time.
With the trail running cold, I phoned up my old mentor, Ted Gwartney, MAI, a renowned assessor and Georgist who played a key role in pushing for modern computer-based appraisal over the past half century. Ted is notable for, among other things, modernizing the entire Canadian province of British Colombia’s property assessment system and establishing its first annual revaluation cycle. I asked Ted if he had ever heard of the Somers method. He said (paraphrased):
Nope. I’ve never heard of it. But I know it works, because I did something almost exactly like that a few times in my career. It works great. I recall that I used it in Hartford, Connecticut in 1972, and Novgorod, Russia in 1993.
Ted went on to describe a community input mechanism he devised nearly identical to the one employed by the Somers system. He said its chief advantage was that it worked even in areas with few land sales, and that the final valuations received far fewer protests than usual because the community was directly involved in producing the valuations. He notes that it’s a particularly useful method for valuing central business districts and commercial land in general, which are particularly difficult to value the conventional way.
That account updated me slightly in its favor, but Ted probably did some things his own way rather than exactly the way the book suggests.
Let’s now walk through the official Somers system, step by step.
Phase 1: Just ask people
It all begins with a blank map of labeled streets and blocks, like this: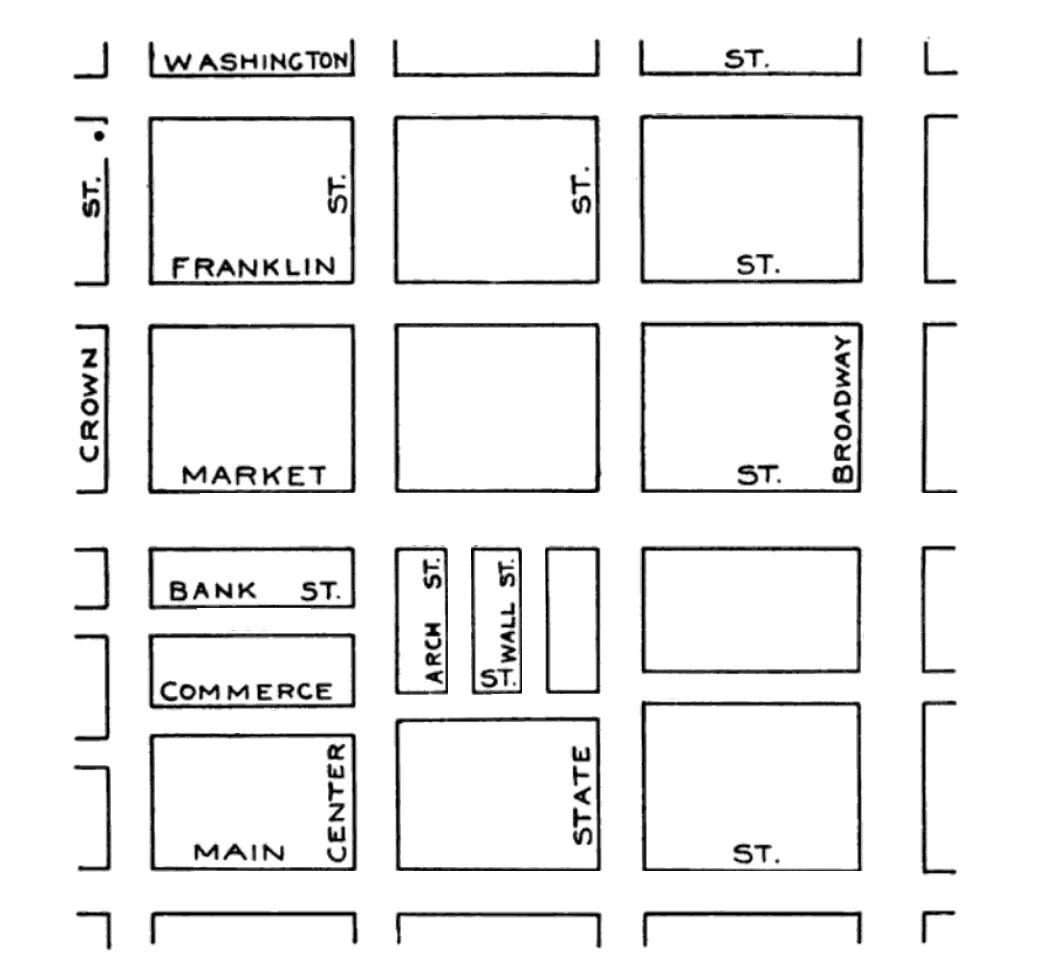
…and ends when you’ve filled in a bunch of little numbers, like this: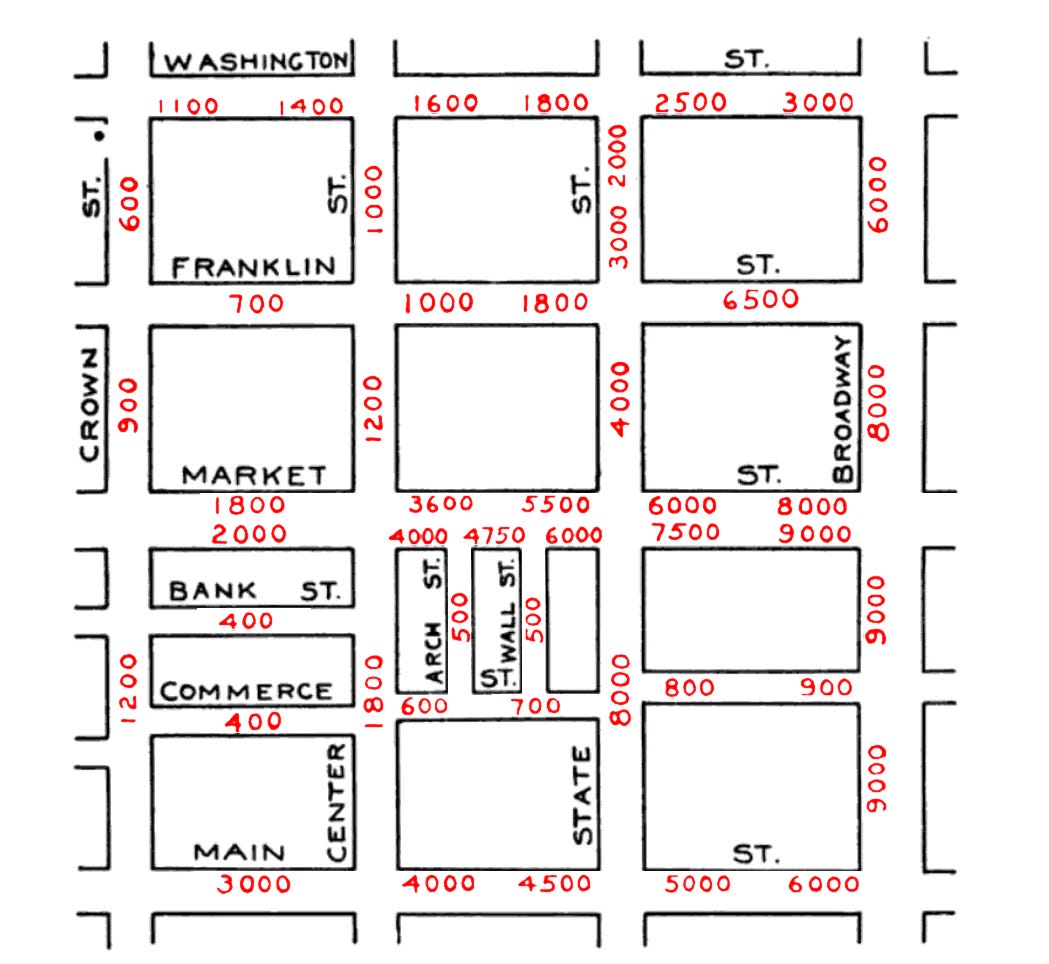
Those numbers aren’t street numbers (as in addresses), but “unit values,” which we’ll explain in detail later. Early passes can be expressed in relative terms, but final values will need to be in actual dollars (or whatever your local currency is).
The best way to understand it is to just picture yourself in one of these meetings. Let’s say you, a local citizen, are summoned to a local Somers system meeting to value your own town. The assessor gavels the meeting to order, then breaks the ice:
Can anyone tell me what the most valuable stretch of street frontage in this city is?
Let’s imagine we’re holding this meeting in College Station, Texas, the city where I went to college and maintain some familiarity with. I expect everyone in the room would give the same reply:
NORTHGATE!
In College Station, this means the northwest-facing side of University drive, and in particular the strip situated between Boyett street and College Main. This is a stretch about 600 feet long just across from Texas A&M University campus where all the most popular bars can be found, especially the Dixie Chicken. That strip is the most valuable piece of real estate in the whole city, a fact anyone who’s lived there for any amount of time knows intuitively.
Take a moment and imagine yourself attending such a meeting in your own town, what would your answer to that question be?
The assessor continues:
See this big map on the wall? Our goal is to come up with a number for each street. The number represents how valuable land on that street is relative to all other streets in the city. I’ve handed out little slips of paper with sections of the city on it so you can write down your own. We’ll have a big discussion, argue back and forth, and once we all agree, I’ll write a number down myself on the big map on behalf of everyone.
Some people in the audience might be business owners, real estate agents, or tenants paying rent who are intimately familiar with real estate values on these particular streets, but there will also be a mixed crowd of all kinds of other people, too. How can we expect normal laypeople to put precise dollar values on everything? The assessor explains:
To keep things easy we’re not going to worry about dollars and cents per square foot, or anything like that—at least not yet. For now I’m just going to write the number “100” right here on Northgate between Boyett and College Main. That just means one hundred percent. One hundred percent of what? One hundred percent of Northgate’s value, which is our anchor street. For every other street, we’re valuing relative to Northgate. Also, this is an “all else equal” situation—so these relative values always assume the same size and shape of lot, the same amount of frontage and depth and all that stuff. Dealing with exceptions and corner cases and special influences is something we’re just not dealing with right now. The only thing that’s changing is where the lot is. How much more valuable is the same kind of parcel if it’s located over here rather than over there. And we express that in terms of what % of value it gets for being in any particular location, compared to if it was situated on Northgate.
The crowd starts warming up and nodding their heads as the assessor moves on:
Okay, now—who can tell me what the second most valuable stretch of land in College Station is?
Now, I haven’t visited Northgate in years, so I can’t tell you exactly what happens next. But somebody local will have a good answer. Probably it’s the adjacent stretch of frontage to the east or west.
Great, thanks for that. Now, relative to Northgate, how much is that worth?
Someone will answer. 95%, or 90%, or 85%, or whatever. Others will disagree. They’ll argue, they’ll hash it out, they’ll write it down on their own little slips of paper. Eventually a consensus or a central tendency will form. The assessor will write that number down, even if it’s a tentative one:
Great, let’s put 95 for now. Remember, we can always come back and change this later, so this isn’t set in stone here. Let’s just keep the conversation going knowing we can always circle back if we later decide on a better answer.
Then the group proceeds to the next most valuable stretch of street. And the next, and the next, until everything within the scope of the current meeting is finished.
In early phases it’s okay to just write down relative values, but at some point the map will need to transition to dollar values. For this the assessor might ask for reference to actual market transactions, leases, or some other kind of local evidence, but ultimately the final ruling will be made by community consensus.
Painting Streets
Let’s talk about little numbers.
In the simplest case we might decide that both sides of a particular stretch of street have the same value across the entire block, so we just write one number in the middle of the street. This means that all parcels on this stretch of Franklin street have the same unit value of 700: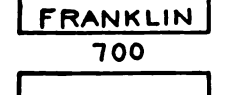
In other cases you might determine that one side of the street is more valuable than the other, such as the north and south face. In this case you write two numbers, one on each side; in the below example we’re claiming that the north side of Market street is worth 1,800 and the south side is worth 2,000: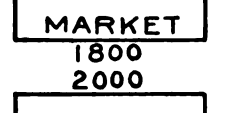
If we think the values are the same from north to south but not from west to east, we express it as depicted below: the block has a value gradient that spans the distance between 1,000 at the westernmost point and 1,800 at the easternmost point.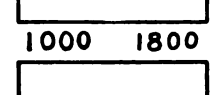
We can break this down into as much detail as we’d like. In the next example we’re saying the north side has a value gradient that spans 6,000 to 8,000 from west to east, and on the south side that gradient spans 7,500 to 9,000, in the same direction.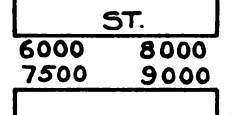
The authors go so far as to claim that small towns employing the Somers system were able to set unit values for their entire municipality in a single meeting. Bigger cities require multiple meetings and more time, but the book implies that even those should be able to comfortably fit within an annual revaluation cycle. In chapter XXI, “Evolution of the Somers System And Some of Its Practical Modifications”, the authors describe how Somers was first able to value all of Cleveland in just six months in 1909, after which his system was installed permanently and used from then on, right up to 1926, the same year the book was published.
But does it track market value?
It’s not hard to imagine a town meeting successfully painting numbers on a map. What is hard to imagine is such a meeting correctly deducing an obscured market signal simply by running an opinion poll.
What is Pollock and Scholz’s answer to this critique?
In Chapter IV, “Inadequacy of Usually Accepted Evidence of Land Values,” they lay out a radical criticism of the market approach, particularly with regards to vacant land:
We are thus led to the conclusion that neither actual selling price, long-term leases, capitalized rentals, nor so-called “market values” of land can serve as accurate bases or indices to be used as evidence for purposes of land valuation. Each one of these may be employed as evidence in checking up values arrived at on the basis of the principles to be outlined subsequently, but in themselves cannot be employed as accurate evidence of fair urban land values.
I want to make clear that I’m not endorsing this claim myself, just analyzing it.
Pollock and Scholz take the bold position that the community values just are the truest and most trustworthy expression of land value, whereas actual market transactions and leases are second-order evidence, suitable for validation purposes but not to be treated as ground truth.
Their chief justification is that as long as you get enough quantity and diversity of input, you will inevitably converge on the underlying truth:
In one western city a map of the central business district comprising the highest-valued blocks was presented to three separate meetings in one day-a large citizens’ and business men’s meeting sponsored by the Real Estate Board, a meeting of 500 high school students, and a meeting of the Women's Political Equality League. Each group readily determined the “best” block frontage, and made intelligent and almost identical comparisons of nearby frontages in terms of percentages of the best frontage. This experience confirms the opinion that there always exists in every community a certain consciousness of the comparative usefulness of the streets and highways under existing conditions.
They claim that it doesn’t really matter who you ask as long as you ask enough people, and as long as they possess knowledge of the local area:
There was a 16-year-old high school girl who knew the best place to locate a candy store; and the women knew all about the locations of the best retail merchants’ stores, although they did not so readily express the underlying reasons for the development of these preferred locations.
The implied mode of action is essentially the same one described in Wisdom of the Crowds, by author James Surowiecki. A concrete example is the classic game show Who Wants to Be a Millionaire, a trivia question show where players could use up three different “lifelines” if a question stumps them—phone a friend, ask the audience, or 50/50. Turns out polling the audience gets you the right answer 91% of the time, whereas phoning a trusted friend is only effective 65% of the time.
On the other hand, we know mass opinion can just as easily be catastrophically wrong; Surowiecki theorizes that crowds only converge on the truth if they possess certain characteristics. According to the Wikipedia summary there are four:
Diversity of opinion — Each person should have private information even if it is just an eccentric interpretation of the known facts.
Decentralization — People are able to specialize and draw on local knowledge.
Aggregation — Some mechanism exists for turning private judgements into a collective decision.
Independence — People's opinions are not determined by the opinions of those around them.
How does the Somers System fare on this rubric?
✅ Diversity of opinion — yup. As long as we do a good job organizing the meeting, we should get all sorts of people from all walks of life with lots of viewpoints.
✅ Decentralization — yup. Seems good.
✅ Aggregation — yup. That’s what the whole rest of the Somers system is.
So far so good! Here’s the one I’m not sure about:🤔 Independence — The town hall could induce a “herding” effect that encourages people to reach an early consensus, and loud, persuasive individuals could easily sway people towards their own opinions. You could try to counteract that with secret ballot votes, but that adds a ton of friction and might do more harm than good. Given the testimonies from people who have tried this maybe the town hall format isn’t actually that that big a deal and people will naturally argue and jostle about enough that it just works?
Three out of four ain’t bad, and the only thing that’s really in question is that of independence. I expect the degree to which the results converge on reality will depend on the number of meetings, the quality of moderation, and how well the meetings are advertised and attended. I can at least imagine it working, even if I’m not ready to take it on blind faith.
That said, Pollock and Scholz’s radical distrust of “direct market evidence” will be a deal-breaker for many, not the least among them modern local governments who have the rule “assess at market value” enshrined in their legal charters. I have a few things to say on the subject:
First—Pollock and Scholz speak out of both sides of their mouth on this topic; in other parts of the book they justify the Somers system explicitly on the basis that Mr. Somers built it by carefully calibrating his system against actual market transactions, and that a key strength of the system is that its results confirm better to market signals than competing methods. A Straussian reading of their apparent market-skeptic heterodoxy might be that they don’t want pesky outlier sales to muddle their sales pitch; namely, that only the pure, consensus voice of the people can be a reliable source of ground truth, and that only the Somers system can properly capture that.
Second—Pollock, Scholz, and Somers are all dead. We can use and adapt their method in any way we want for our own purposes even if we don’t buy into every part of the inventors’ personal ideology. I can use the Pythagorean theorem without giving up eating bean burritos, or Calculus without having to believe everything is composed of monads.
Third—whether or not the Somers system generates values that converge on observable market transactions is a testable hypothesis—we can just try it and see.If it turns out it does agree with market signals, the objection is overcome regardless of what Pollock and Scholz professed. And if not, we’re back to the status quo.
Finally, even if you don’t buy into the “just ask people” part of the Somers system method at all, you may still be interested in the mechanical bits that follow. There’s no reason you couldn’t implement a hybrid Somers system using the market approach, where you let sales transactions and regression algorithms draw your initial land value map, and then feed that to the phase 2 algorithm.
Phase 2 — Unleash the nerds
Back in Pollock and Scholz’s day, final values would be hand-calculated by a team of human “land computers” armed with piles of paper and slide-rules. Today you could get the job done much quicker with computers, databases, and many fewer technicians. Either way, everything starts with the little numbers on the map, the “unit values” which serve as inputs to the algorithm.
Before we can begin, we need to understand what the little numbers truly represent. They’re denominated in dollars, but dollars per what? Dollars per Somers unit-foot, of course. A Somers unit-foot being “one foot of frontage, extended one hundred feet in depth backwards from the lot line.”
Um… what?
Time to unpack some jargon.
Frontage and Depth
Frontage measures how much distance a parcel fronts, that is, the distance it runs directly alongside, a particular street. A parcel only gets frontage if it is literally “on” the street. A landlocked parcel with no road access at all, such a backlot in the center of a large block, has zero frontage. Frontage is measured in linear units, such as feet or meters, never square units. A “front foot” is one foot of frontage.
What’s “depth?” Well, if frontage is the length of the side of the parcel that runs alongside the street, depth is just the length of the other side of the parcel.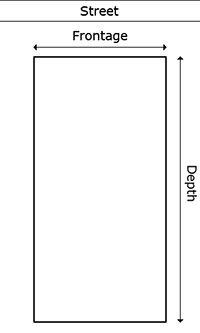
If a parcel happens to run alongside two or more streets—i.e., if it’s a corner lot—then it has multiple frontages and depths, each expressed relative to its respective street. The same side can count as either frontage or depth depending on which street you compare it to.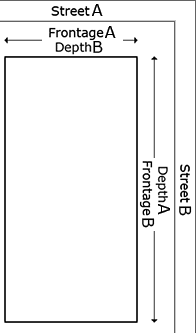
The Somers “Unit-foot”
In conventional mass appraisal, the accepted units of valuation are square feet, acres, or front feet, which the assessor often switches between depending on what’s being valued. For farmland, acres are preferred, and for waterfront property, one often uses front feet. The Somers unit is completely different.
Why did Somers invent a completely new unit? What was wrong with the old ones?
The problem with valuing by square feet is that not all square feet are equally valuable, even those found within an individual parcel. For instance, the square feet closest to the street are worth much more than the square feet one hundred feet back.
The issue becomes clear with a concrete example. Imagine we have two parcels fronting some valuable street—Lot A, with 50 feet of frontage and 100 feet of depth, and Lot B, rotated 90 degrees the other way: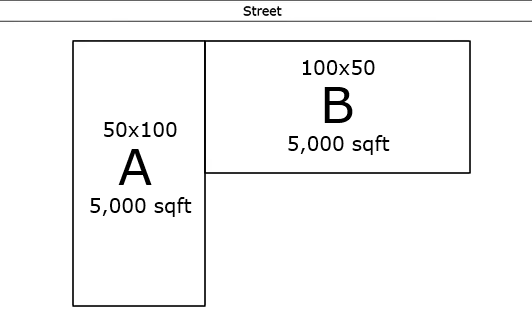
In real life, Lot B would tend to be the more valuable lot because it has more frontage. However, since they’re both 5,000 square feet, they’re identical in the eyes of the assessor’s local land table, which assigns a certain value per square foot at this location and size.
What are our alternatives? We could value by linear front feet alone, but this would lead us to a different error, valuing B at twice the value of A.
Assuming that both locations along the street are equally valuable, we would expect B to be more valuable than A, but probably not twice as valuable—depth counts for something, even if it doesn’t count for as much as frontage.
How do we solve this problem? We could maintain two separate sets of valuation tables for this local area—one for square feet and one for front feet, or else we could construct complicated adjustment tables that give us the flexibility to deal with cases like this by adding, subtracting, or multiplying values after the base land value has been set.
Or we could use a different unit of value. Enter the Somers unit-foot, as the authors style it, which I will call the “Somers unit,” or su, for short.
The Somers “unit foot” is not a square foot, nor is it a front-foot. Instead it is a front-foot extended back from the street 100 feet in depth. So if you have a 50x100 foot lot (50 feet of frontage by 100 feet of depth), that’s “5,000 square feet,” but it can also be expressed as “50 Somers units.” 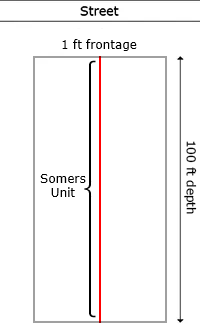
Okay, but how many “Somers units” is a 100x50 foot lot—the same size but rotated 90 degrees relative to the street?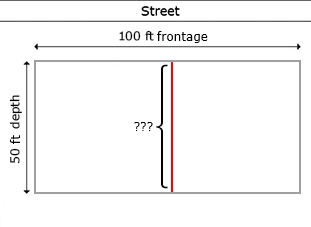
It’s got 100 feet of frontage, and 50 feet of depth, which is only half the depth of the standard 100 feet deep, so is that… also 50 Somers units? 100 cut in half?
Nope!
Orientation matters, and it matters a lot, because frontage and depth aren’t interchangeable. In the Somers system, the value of the lot scales linearly with frontage, but with sharply diminishing returns with depth. Here’s a handy chart they use, the “Somers Depth curve:”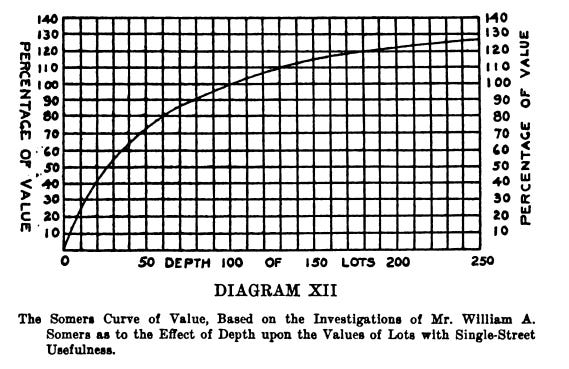
This depth curve tracks how lot value changes non-linearly with depth. So how much is one foot of frontage worth if it’s only 50 feet deep? According to this, it’s worth 72.5% of whatever a standard-sized (100 foot deep) lot is worth. Value does keeps increasing if you go beyond100 feet of depth, but at a sharply declining rate; 150 feet gives you only 115% of the value of a standard lot, and doubling the depth to 200 feet yields a mere 120% of relative value. Here’s a handy illustration to visualize the relative value of different depths, with frontage held constant: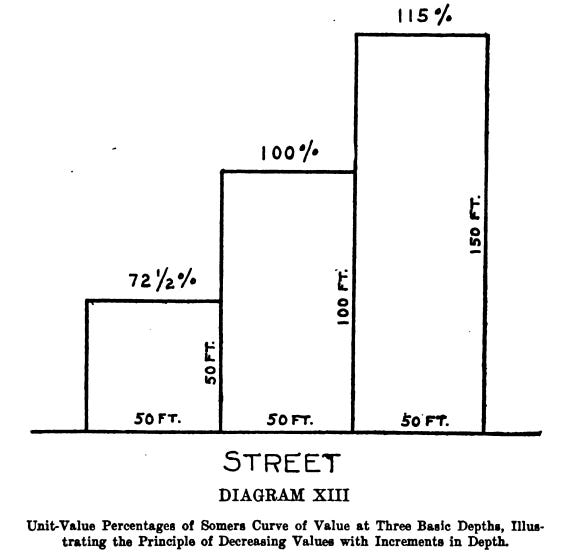
We’ll discuss how they derive the depth curve and how much we trust it in a bit, but for now let’s return to our previous example, armed with the Somers unit: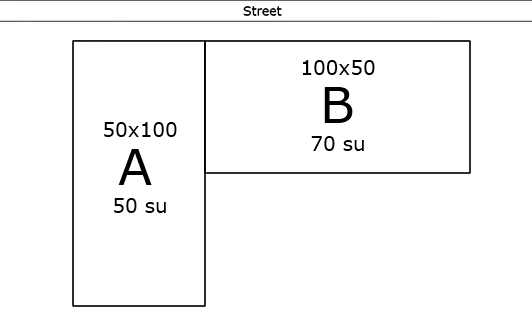
Lot A has 50 feet of frontage, and its depth is the standard size, so that’s 50 Somers units (su). Lot B has 100 feet of frontage, but only 50 feet of depth. The depth curve tells us that 50 feet of depth yields 70% of the value as 100 feet of depth, so we multiply 100 feet of frontage by a 0.7 and get 70 Somers units. Now we can directly compare these two parcels to each other in terms of relative value.
Another way to visualize this is to paint a visual gradient across our parcels, emanating from the street. In this example I used Photoshop to roughly match the gradient as well as I could to the Somers depth curve. Here the intensity of the pixels matches relative value—white is more and black is less. Under this model, you can clearly see how much extra value Lot B is gaining from its enhanced frontage, and how much less value Lot A is gaining from its longer backyard. You can also clearly see how disproportionately valuable those first few feet of frontage are.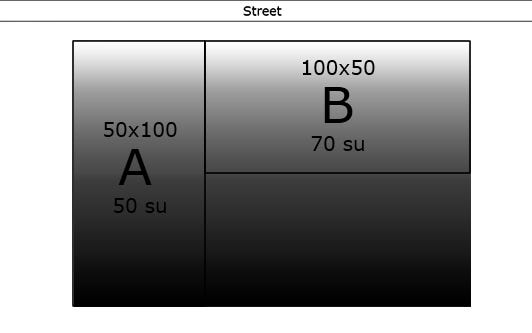
If we chop off the bottom half of A and stick it right next to the top half, and then compare both parcels side by side the difference in value due to diminishing returns to depth becomes clear:
Anyways, according to the Somers system of valuation, lot B is 1.4X times as valuable as lot A (70/50 = 1.4), all else held equal.
This then is what you are painting your streets with—the value of a single Somers unit at each location. When we write “700” on Franklin street, we mean that one Somers unit on Franklin street is worth $700:
Now all we need to do in order to calculate the land value of all the parcels on either side of Franklin street is to follow these steps.
Measure depth and frontage for each parcel
Calculate each parcel’s size in terms of Somers units
Multiply (Somers units) x (local unit value)
That’s it. Under the Somers system, if you can fill in the blanks, you can value the entire city.
If you’re like me at this point you’re immediately thinking of a million questions. What about corner lots? What about irregularly shaped lots? What about alleys? What about roads that meet at weird angles? What about seven million other things?
Believe it or not, the book addresses pretty much any complication you can think of and has some straightforward method of dealing with it. For instance, the above examples all apply to interior lots only—lots that are free from corner influence. There’s a whole section on dealing with corners, which basically amounts to overlaying two value gradients at perpendicular angles, one from each street, and summing the results together.
Circling back to the depth curve, we come to another bold claim—the depth curve is meant to be universal. That is, the rate of diminishing returns to depth is the same in not just all parts of the city, but in every city. The story goes that Mr. Somers first built the curve for St. Paul Minnesota based on careful observation of sales transactions, and subsequently refined it over the decades as he used it in various different cities. “Many years were spent, and thousands of tests were made, before he determined the curve upon which his depth percentage for inside lots was based.” The book further claims that competing depth curves were found to produce only “slight and unimportant variations.”
I’m not sure I buy the Somers depth curve’s universality (especially 100 years later), but I am willing to buy that something like the claimed relationship between depth and value is true. Anyone with five minutes of experience in real estate valuation notices that land value has diminishing returns with size. Here’s a typical example from the Marshfield, Massachusetts board of assessors:
If a lot is to be considered “buildable” or has improvements already in place, the smaller the lot, the higher the square foot value.
If it works, the Somers unit-foot and its diminishing depth value curve would be an elegant way to efficiently normalize the complexities of parcel size.
Streets vs. Land Economic Areas
One peculiarity of the Somers system—location is defined not in terms of parcels or even neighborhoods, but in terms of streets. Individual parcel valuations are wholly downstream of street valuations.
This is in sharp contrast to conventional modern mass appraisal, where the principle way you establish land values is by setting a set of base land rates for each appraisal neighborhood or land economic area (LEA). In this system, the assessor carves up space into contiguous areas, with the presumption that the base value of land within each LEA’s borders adheres to same mathematical curve, with size (expressed variously in terms of square feet, acres, or front feet) being the primary driver of value.
Here’s a simple example. Let’s say that in neighborhood A, all land is worth this:
$5 for each sqft up to 0.5 acres
$3 for each sqft after that up to 1.0 acres
$1 for each sqft after that
Here’s how that math works out:
0.25 acre lot = 10,890 feet x $5 = $54,450
0.50 acre lot = 21,780 feet x $5 = $108,900
1.00 acre lot = (21,780 feet x $5) + (21,780 feet x $3) = $108,900 + $65,340 = $174,240
The LEA approach doesn’t mean that land is treated as having the same value per parcel throughout the area, nor does it mean that land has the same value per unit area, just that land maintains the same relationship between value and size within these boundaries.
In neighborhood B, the exact dollar values at each stage may differ, but the basic structure would be the same, and the marginal value of each subsequent tier would have the same kind of decreasing trend. Marshfield, Massachusetts has a particularly good example of what a typical LEA-based land valuation table looks like: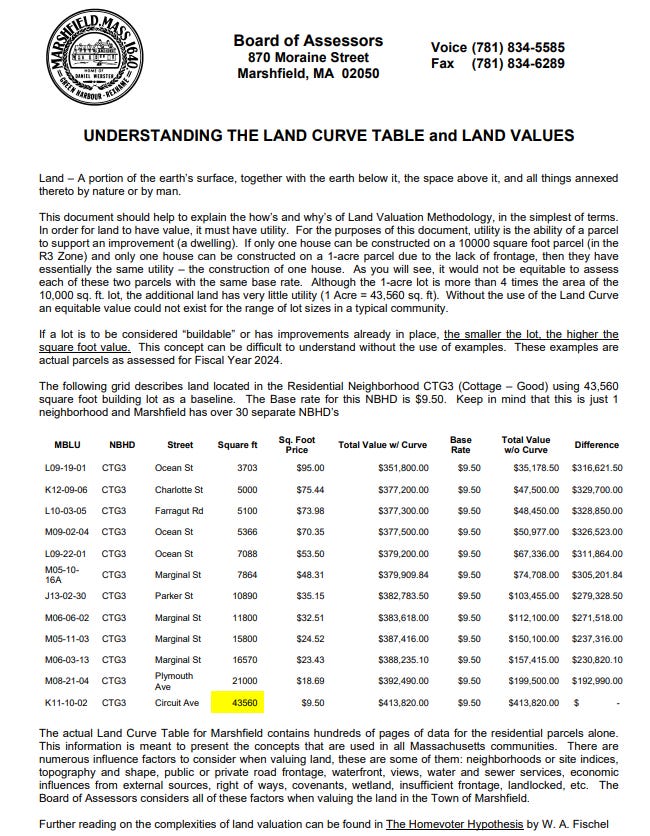
Variations in land value not accounted for by the base LEA table (such as those due to irregular shape, lack of road access, etc.) must be handled through separate adjustment tables layered on top, which can grow to be arbitrarily complex.
I don’t have any particular beef with the LEA approach, in fact I’ve often used it myself, I just mention it as a point of contrast with the Somers approach.
Evaluating the Somers System
And that, ladies and gentlemen, is the Somers System in a nutshell.
You summon a town meeting, and paint little numbers on the map. Then you calculate each parcel’s land value by multiplying its size in Somers units by the unit value of land at that location. This gives you the power to value every standard-shaped interior lot. From there you use supplementary methods to deal with things like corner influence, alleys, irregularly shaped parcels, and a million other things. They’re all covered in the book.
So how does the method stack up? We’re going to ask three questions:
Can it converge on market value?
Is it suitable for conventional property tax assessment?
Is it suitable for land value tax assessment?
Let’s start by interrogating its assumptions. It rests on these:
Community consensus is ground truth for land value
Land value scales linearly with frontage
Land value has sharply diminishing returns to depth
Community consensus is ground truth for land value
Pollock and Scholz simply assert this tautologically, but leave open a window for using market evidence for “validation” purposes.
If we insist, as most local government do, that we can only trust values shown to converge on market value, then we must do our own empirical validation by comparing a set of Somers system land valuations to a holdout set of trusted land sale transactions that stakeholders agree are representative of market value.
Land value scales linearly with frontage
This clearly does not hold true for all possible values of frontage—a contiguous piece of land that stretches along a street for miles will have far fewer prospective buyers, and thus fetch a lower price per front foot, than one that fronts only fifty feet. That said, I’m willing to believe that land value scales in an approximately linear fashion, especially at the scales most frequently represented in urban contexts. Perhaps we could study this to determine at what scales price elasticity for frontage starts to kick in.
Land value has sharply diminishing returns to depth
I need no convincing of this basic principle, I’m just not sure of the exact shape of the curve and how universal it is. I’m also willing to posit some exceptions to the general rule—clearly there’s some minimum amount of depth below which a lot becomes unbuildable and therefore useless.
Even if I’m willing to nitpick at the edges and don’t fully buy in to Pollock and Scholz’ personal philosophies, I’m genuinely impressed by the system and find that it has real insights that we can apply to mass appraisal today. Now let’s answer our three evaluation questions.
Can it converge on market value?
I think it could. There’s a plausible mechanism in the wisdom of the crowds effect, and even though I can come up with a thousand theoretical reasons it could never work, the historical testimony of cities relying on it for decades is hard to summarily dismiss.
I’m reminded of Scott Alexander’s The Buying Things from a Store FAQ, in which he pokes fun of skeptics who rely too much on theoretical objections to new ideas, suggesting all sorts of theoretical reasons why the simple act of buying things from a store couldn’t possibly work:
3: Most of the items in stores are in boxes. Couldn’t the storekeeper just sell you an empty box (or a box containing only sandbags or some other weighty objects), then accuse you of having made it up if you complained later?
See the answer to (1). If a storekeeper did this regularly, they could go to jail. Also, they would get a reputation as a bad storekeeper and lose repeat customers.
He concludes with:
it seems to run pretty well despite a dozen theoretical objections, and this makes me trust theory less. We should still debate the theoretical questions, if only for the mental tranquility of feeling like we understand what’s going on. But overall I expect these kinds of objections to be overcome by creating the thing, subjecting it to market pressure, and seeing what solutions people come up with.
I feel the same way about the Somers system. Let’s try it and see.
Is it suitable for conventional property tax assessment?
The short answer is “partly,” because the Somers system is only concerned with valuing land, whereas conventional property tax assessment must value the land and the buildings. The only treatment of building values in Pollock’s book are a few terse passages indicating that you should just use the cost approach—that is, estimate the replacement cost of building a brand new version of the building, then subtract depreciation due to age, condition, and obsolescence.
That said, if the Somers system works it would be a great aid to modern property tax assessors. This is because the dominant form of mass appraisal is the “sales adjusted cost approach,” in which assessors start with the cost book value of buildings. From there they have to come up with some consistent and defensible way to close the obvious yawning gulf between nominal structure values and the observed selling prices of actual parcels, much of which is presumably due to land value.
Additionally, the Somers system has four particularly appealing features, regardless of whether you accept that it tracks market value. It:
achieves community buy-in ahead of time
is straightforward to explain
generates consistent, locally uniform, well-equalized values across the city
works even if you don’t have many (or any!) vacant land sales
There are plenty of assessors who would happily trade off some degree of accuracy with regards to market value for any one of these features alone. When we consider that there are many jurisdictions where land value is assessed in an ad-hoc manner, such as a fixed flat value assigned to every vacant lot, or improved land being set equal to a flat X% of the total assessed value, regardless of location or any other characteristics, it seems unlikely that Somers system would do a worse job of valuing land than the status quo.
I should note that despite the enthusiasm with which the Somers system was received by Georgist activists, the book professes only lukewarm commitment to the cause. As obsessed as the Manufacturer’s Appraisal Company was with promoting “scientific” land valuation, they maintain a friendly aloofness, even agnosticism, to Georgism itself:
A question frequently asked is: "What relation, if any, does the Somers System bear to the Single Tax? "
The answer is that neither the Somers System nor any other possible system of accurate comparison of land and building values bears a peculiar relation to any economic theory concerning the propriety of taxing or untaxing specific kinds of property.
They simply insist their system makes any property tax system better. Reading between the lines, one might note that staying politically neutral would maximize the company’s chances of selling to both pro- and anti- Georgist jurisdictions alike.
Is it suitable for land value tax assessment?
Probably! Assuming it works at all, it would presumably work just fine for land value assessments, and the historical testimony suggests just that. In the few places in the United States that variants of Land Value Tax overcame political barriers to see the light of day, such as J. J. Pastoriza’s short-lived experiment in Houston, some version of the the Somers system was used to drive the valuations.
Would it work today? Well, just as “the Somers system converges on market value when compared to validated land transactions,” is a testable hypothesis, so is this:
If a city adopts the Somers system to value all its land, and then adopts a pure Land Value Tax on the basis of those assessments, we will observe all the positive results that Georgist theory predicts.
The proof is ultimately in the pudding. Use the Somers system to arrive at land valuations and pass a universal building exemption in a few existing property tax jurisdictions, and see what happens. Positive results would cut through the Gordian knot put forth by extreme skeptics who confidently proclaim that land cannot be accurately assessed as a matter of fundamental principle.
Taking a more politically sober note, the strongest obstacle the Somers system must first overcome is demonstrating that it tracks market value, given that approximately all jurisdictions insist on that in their legal codes.
But even if the community input phase should be found unacceptable, phase 2’s algorithm still has much to recommend it as a potential improvement to conventional land tables.
Towards a modern Somers System
Phase 1 of the Somers System could easily be run in the modern day in a manner more or less exactly as described in the book. If you want a primer, I recommend Chapter XI, “Procedure at Committee Meetings or at Public Meetings for the Purpose of Community Assessments.”
There are a few modern conveniences we could use—you could replace the “big map on the wall” with a laptop, projector, and Felt.com, or as I like to call it “Google docs for maps.” I’ve practiced using these tools myself with a tiny fake audience and it seems to work fine. That said, I would stop short of coming up with some galaxy-brained audience participation phone app or whatever; too much technology can easily cause more problems than it solves when it comes to running an efficient meeting. I would be perfectly happy to run a meeting with pen and paper exactly as described in the book.
Phase 2 is where technology can be most helpful. Here’s a high level strategy for implementing the algorithmic portion of the Somers system by computer:
Procure a local parcel map and a local street network graph
Tag every parcel with street frontage and depth information
Using street intersections, compose polygons representing city blocks
For each polygon, use phase 1 inputs to assign $/su value gradients across the polygon edges
Project street value gradients across each polygon, emanating perpendicularly from the street edge.
Carefully handle gradients emanating from “curved” surfaces composed of individual line segments.
Also handle gradients in $/su value that change across the street frontage itself
Rasterize the result as a GeoTIFF file at the resolution of 1 pixel:1 frontage unit
For each polygon, join it with the GeoTIFF file and get the set of pixels within its boundaries
Sum up the value of the pixels and assign that as the parcel’s land value.
Unfortunately, this all depends on starting with accurate street tagging for every parcel in the city. This can be a daunting task, even for a modern office.
Fortunately, there’s plenty of free and standardized open data sources to draw from, modern computers are fast, and also I’ve already written the necessary code and you can have it for free.
Open Source Street Tagging Algorithm
You can find an open source implementation of a comprehensive street tagging algorithm right here. This is from our free and open source library OpenAVMKit, currently under “soft launch,” as in super-pre-alpha status. Please pardon our dust and set your expectations accordingly.
We download the local street network from the Open Street Map project, project perpendicular rays out from either side of every road, repeated at a uniform spacing distance, e.g. every N feet or meters. Then, for each parcel, we count how many rays intersect this parcel without first intersecting another, then count up how many rays come from each street, multiplied by the spacing distance.
For example, if a parcel touches 45 unblocked rays emanating from Main street, and our spacing distance is one foot, we assign that parcel 45 feet of frontage with respect to Main street. The resulting frontage estimates are accurate to within a unit or two of your chosen ray spacing. Tighter ray spacings increase precision at the cost of longer computation time.
This method allows us to assign good approximations of frontage in nearly all cases, even when the parcel or road is curved or irregular in shape. There are a few known bugs, such as a highway with the same road name on both North and Southbound lanes, which results in nearby parcels being assigned twice the correct amount of frontage. Those aside, the method works well. We record up to four frontages and depths per parcel, and also note the name, type, facing, angle, and distance to the roads to which those measures correspond. Corner lots can be identified by noting which parcels front more than one street.
I have not yet completed implementing the rest of the algorithms needed to complete phase 2 of the Somers system, but any competent GIS programmer should be able to finish the job based on my provided outline above. Or you can wait for me to eventually get around to it.
Let’s Try It!
As I’ve suggested throughout, the only way to know for sure whether the Somers method works in the modern day is for someone to try it and see what happens.
If the authors’ claims hold true, it shouldn’t matter exactly who you gather together as long as you get enough people with real local knowledge, and run the meeting in the manner prescribed. The rest is just math.
I’ll be traveling a bit this year, and if I get the opportunity I will try to organize some small-scale trials of Somers meetings just to see what it’s like. I would encourage anyone who finds this method intriguing to try it themselves in their own communities—you don’t need to value the whole city, even a few blocks might be enough to learn some things. Please share your results with me if you do, as I would be happy to advise and collaborate.
UPDATE:
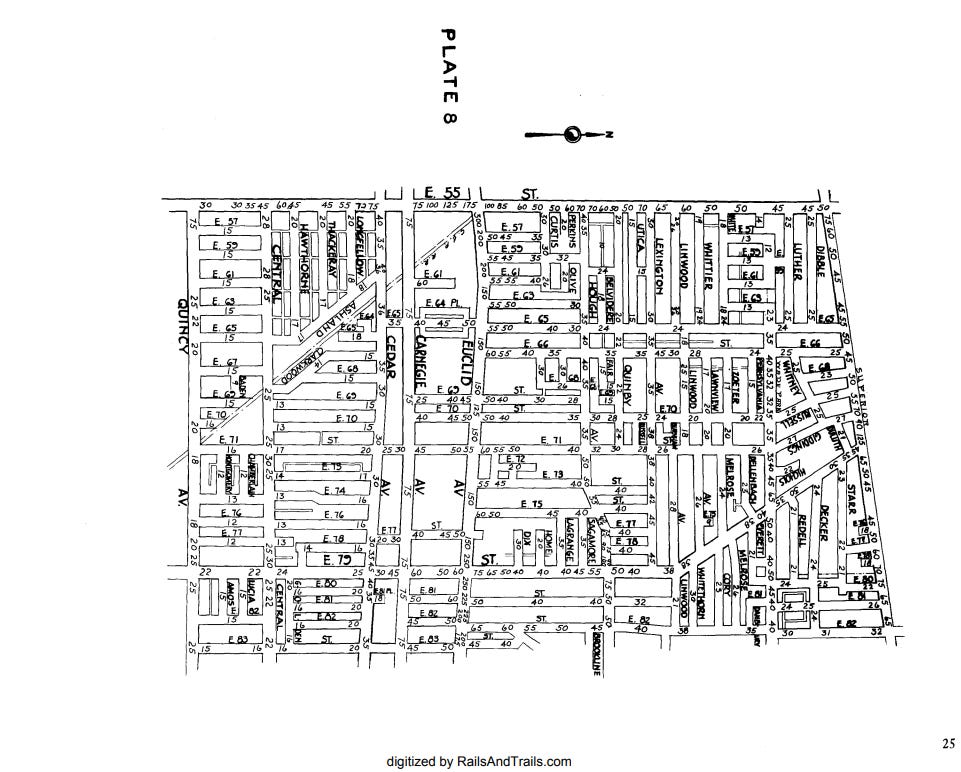
I just tracked down a few historical artifacts of the Somers system in use. Here you can find an early and a late example of its use in Cleveland, Ohio. The first from 1910, the last from 1946, both conducted under John Zengerle, the county auditor.
1910 assessment
1946-1947 assessment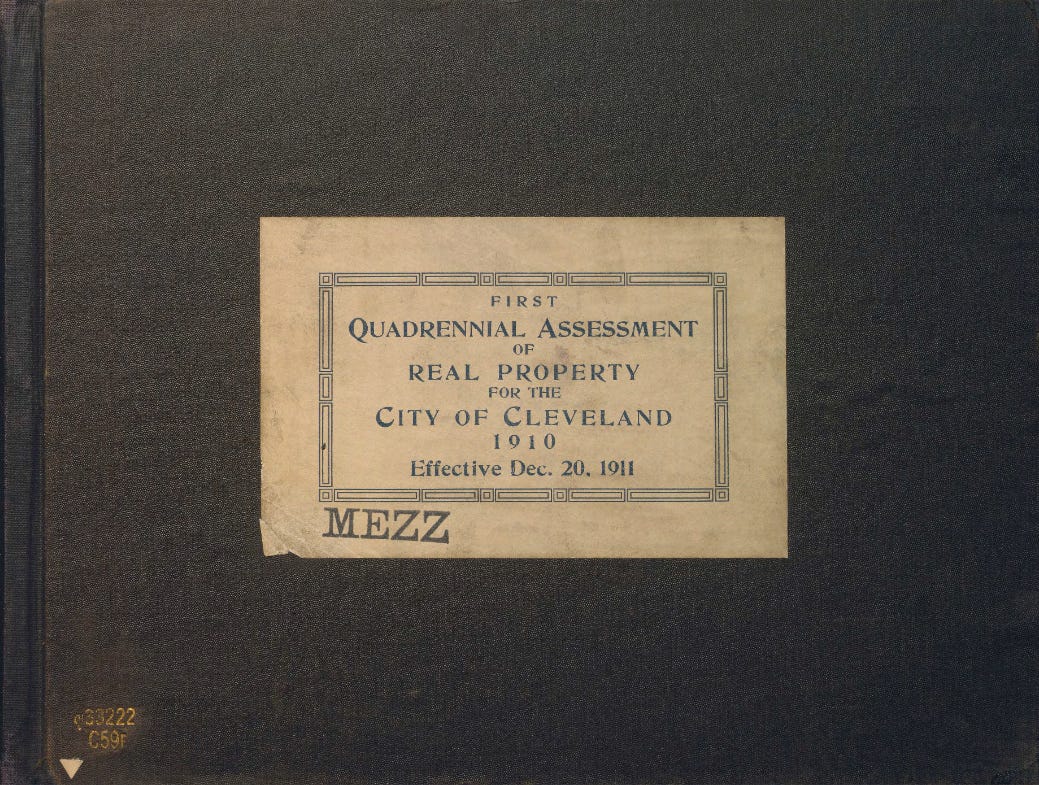
Progress and Poverty is a reader-supported publication. To receive new posts and support my work, consider becoming a free or paid subscriber.
What's Your Reaction?
 Like
0
Like
0
 Dislike
0
Dislike
0
 Love
0
Love
0
 Funny
0
Funny
0
 Angry
0
Angry
0
 Sad
0
Sad
0
 Wow
0
Wow
0