


'Biggest trade deal ever' — 5 things to know in Bitcoin this week
Bitcoin gets an early macro tailwind as the US seals trade deals, but plenty of BTC price volatility catalysts are waiting in the wings into August.
Bitcoin (BTC) heads into the July monthly close eyeing $120,000 as a BTC price rebound holds firm.
BTC price action is giving market participants cause to expect all-time highs again, but the threat of a $113,000 comedown remains.
A giant week of US macro data combines with the Fed meeting on interest rates amid pressure on Chair Jerome Powell.
The US-EU trade deal provides an instant boost for risk assets, including a record open for S&P 500 futures.
Bitcoin’s performance in July 2025 may feel impressive, but it still has a way to go to stand out against historical norms.
Stablecoin liquidity suggests that bulls may need to wait before getting the momentum necessary to reenter price discovery.
Bitcoin bulls running at $120,000
A late-week surge placed Bitcoin price action within striking distance of $120,000, but momentum ultimately failed to follow through.

Despite that, BTC/USD managed to hold the area around $119,000, per data from Cointelegraph Markets Pro and TradingView, emboldening market participants to expect further upside next.
“If Bitcoin can tighten up and hold over $117,000 then i think we are good for new ATHs very soon,” trader Crypto Tony forecast in a post on X Monday.

Trader and analyst Rekt Capital said that Bitcoin had “kickstarted” a bull flag with its $119,450 weekly close.
“In which case turning ~$119200 into support via a retest could occur next week (maybe even via a wick),” he told X followers alongside an explanatory chart.
“However, for the moment BTC needs to avoid an upside wick beyond the Bull Flag Top resistance otherwise price would stay in the Range.”

On Sunday, Cointelegraph reported on traders’ liquidity expectations for the coming days. Exchange order books showed two key zones above and below the price, with analysis seeing the potential for a return toward $113,000.
“For $BTC, we’re sitting at about 58.7% longs stacked against 41.3% shorts. That means there’s a decent amount of fuel for a move up if shorts get flushed, but not an overwhelming amount that screams ‘squeeze incoming,’ analyst TheKingfisher argued while examining liquidations.
“It's balanced enough that we could see more chop until one side really commits.”

The latest data from monitoring resource CoinGlass shows bid liquidity laddered between $116,800 and $118,300.
FOMC week begins with Powell in focus
If much of July was relatively quiet in terms of US macroeconomic data, the tables are about to turn.
The Federal Reserve interest-rate decision forms the highlight of the coming days, but this is far from the only point of interest for risk-asset traders.
Q2 GDP is due just hours before the Federal Open Market Committee (FOMC) meeting on Wednesday. The day after, the Fed’s “preferred” inflation gauge, the Personal Consumption Expenditures (PCE) index, will be released.
“We have a massive week ahead of us,” trading resource The Kobeissi Letter summarized on X.
Kobeissi added that corporate earnings will continue to pour in, creating “the most data-packed week of the year.”
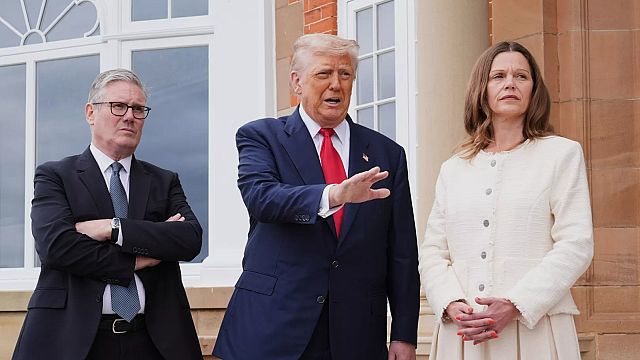
That data comes at a crucial time for markets. The ongoing divide between government expectations and Fed policy continues to boil over into the public eye, with President Donald Trump actively calling on Fed Chair Jerome Powell to cut interest rates.
🇺🇸 JUST IN: Jerome Powell tells allies he won’t resign despite Trump’s pressure to slash interest rates. pic.twitter.com/KWw42wb9mB— Cointelegraph (@Cointelegraph) July 25, 2025
Powell has remained hawkish throughout 2025 as inflation data continues to paint a mixed picture — cooling costs with a resilient labor market — allowing the Fed to maintain current policy.
The latest data from CME Group’s FedWatch Tool confirms that markets see hardly any chance of a rate cut emerging from the FOMC this week, with bets still favoring the September meeting.

“While the July meeting is widely expected to see no change in rates, investors will be looking for clues on rate cuts during the remaining meetings of the year,” trading firm Mosaic Asset confirmed in the latest edition of its regular newsletter, The Market Mosaic.
“Fears over inflation will continue to be a restraining factor on the outlook, with evidence of tariffs impacting the most recent Consumer Price Index (CPI) report.”
Mosaic referred to the June CPI print coming in above expectations.
US trade deal progress sparks risk-asset rally
Balancing the myriad volatility risks from macro data is good news for markets more broadly: the US sealing a trade deal with the EU and Japan, while delaying implementation of tariffs on China for another 90 days.
🔥 TODAY: The US and EU struck a major trade deal
• 15% tariff set on most EU goods
• Key sectors like aircraft, semiconductors, and pharma exempted
• EU to purchase $750B in US energy
• $600B in EU investments pledged, including defense buys
• Steel and aluminum tariffs… pic.twitter.com/9IIIHmiJQL— Cointelegraph (@Cointelegraph) July 27, 2025
These key events had an instant impact on sentiment and risk-asset performance.
US stock futures surged, with the S&P 500 opening above 6,400 for the first time in history as a result of the trade announcements.

Both Trump and European Commission President Ursula Von Der Leyen called the result the “biggest trade deal ever,” with the latter noting that the US and EU together account for 44% of global GDP.
“Easing trade tensions and liquidity tailwinds are sending the S&P 500 to fresh record highs while volatility falls to the lowest levels since the start of the year,” Mosaic Asset commented on the trade topic.
Mosaic added that the economic backdrop in the US also favored risk-asset growth. Specifically, it flagged M2, a “broad measure of the US money supply” which has increased 4.5% year-on-year.
“M2 bottomed and has been recovering since 2023, and is now making a new record high alongside major stock indexes,” it noted.

As Contelegraph reported, Bitcoin and crypto performance have been closely tied to global M2 liquidity trends throughout crypto market history.
A July like any other for Bitcoin?
At around $120,000, Bitcoin has certainly delivered for bulls this month, but historically, July tends to perform better.
CoinGlass data shows that while BTC/USD is up 11.3% in July 2025, it is only marginally above the average over the past 12 years.
Since 2013, July has delivered an average of 7.85% price upside, with median gains at 9.6%.
Even in 2022, Bitcoin’s most recent bear market year, July managed to offer upside of nearly 17%, CoinGlass confirms.

A further comparative chart uploaded to X by network economist Timothy Peterson on Sunday underscored the status quo.
Bitcoin in July https://t.co/wEGc88zhvf pic.twitter.com/tt9RVnFHKK— Timothy Peterson (@nsquaredvalue) July 27, 2025
Ahead of the monthly candle close, trader and analyst Aksel Kibar stressed that bulls need to hold early July gains.
“Breakout in the first week of July was with a long white candle,” he told X followers alongside a chart with a $141,300 target.
“It is important not to give back those gains during the pullback. It will show positive momentum. So far price held well above the horizontal support at 109K.”

Average August returns for BTC/USD are decidedly less impressive, meanwhile, at just 1.75%.
Stablecoin liquidity poses questions
Those hoping for a swift continuation of the Bitcoin bull market may need to wait a while longer.
Related: XRP dip was a ‘healthy correction,’ Ether supply shock: Hodler’s Digest, July 20 – 26
New research from onchain analytics platform CryptoQuant highlights a factor that tends to cap BTC price upside until it resolves.
The stablecoin supply ratio (SSR) has been growing in step with BTC/USD, something which could signal a lack of stablecoin liquidity, or “dry powder,” available for investment.
“A rise in this indicator indicates that stablecoins are few compared to the volume of Bitcoin. In other words, liquidity is weak, and therefore the market lacks the high purchasing power to support Bitcoin,” contributor Arab Chain explained in one of CryptoQuant’s Quicktake blog posts on Monday.
“The indicator's rise, along with the rise in Bitcoin's price, indicates that this rise is occurring without new stablecoins entering at the same pace. A continued rise in the indicator may indicate that buying momentum may weaken in the future due to low liquidity.”

SSR reached its latest all-time highs in November 2024, a level nearly — but not quite — eclipsed on July 14.
Arab Chain thus argued that the market may be entering a period of “temporary saturation.”
“This indicates that the market is still partially supported by liquidity, but a continued rise in Bitcoin requires a significant increase in the stablecoin reserve in the coming days,” it concluded.
This article does not contain investment advice or recommendations. Every investment and trading move involves risk, and readers should conduct their own research when making a decision.
What's Your Reaction?
 Like
0
Like
0
 Dislike
0
Dislike
0
 Love
0
Love
0
 Funny
0
Funny
0
 Angry
0
Angry
0
 Sad
0
Sad
0
 Wow
0
Wow
0